Probe Points: Understanding Low Frequency Response

The Practice of AC Coupling and DC Reject Modes
The practice of AC coupling the scope input or using a probe with DC reject capability is very common when looking at noise and/or ripple of DC power rails. Anytime there is insufficient DC offset available, then users often elect to use AC Coupling or DC Reject settings. With the focus on clean power, we see users more interested than ever before in understanding the voltage and noise characteristics of their power sources.
Exploring AC Coupling and DC Reject Modes
This post explores some of the perhaps unexpected or unknown characteristics of using AC coupling or DC Reject modes and how they ultimately may lead to incorrect conclusions. Functionally, when we think of either of these modes, we can visualize placing a capacitor in series with the input to the scope and therefore how this could impact the low-frequency response. More often, when we think of probes and oscilloscopes, we look at the high-frequency response and roll-off characteristics and ignore the low-frequency behavior.
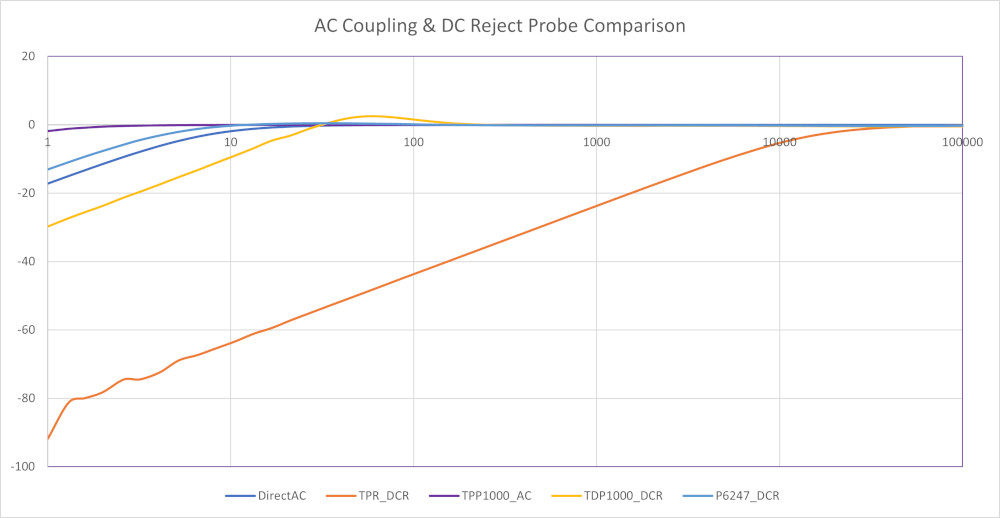
Note that the numbers portrayed in this post represent experimental results and are not meant to reflect actual guaranteed specifications. The plot above compares the low-frequency response of several setups and illustrates the differences.
In the plots above in the first image, I chose 1 Hz as the low-frequency limit for practical sake and 100 kHz as the high limit, as all probes behaved similarly above 100 kHz. The table below gives more detail and shows the measured 3dB bandwidth for each of the different probing/setups used.
| Connection | 3dB roll off (LF) | Comments |
|---|---|---|
|
Direct AC |
7 Hz |
No probe, AC coupling |
|
TPR_DCR |
16 kHz |
TPR1000 Power Rail Probe, TekVPI™ probe interface, DC Reject mode (datasheet) |
|
TPP1000_AC |
< 1 Hz |
TPP1000 10x Passive Probe, TekVPI probe interface, AC Coupling Mode (datasheet) |
|
TDP1000_DCR |
22 Hz |
TDP1000 Differential Probe, TekVPI probe interface, DC Reject mode, 4.25V range (datasheet) |
|
P6247_DCR |
5 Hz |
P6247 Differential Probe, TekProbe™ interface, DC Reject mode, X1 (datasheet) |
Data was collected using the FRA (frequency response analysis) tool included in the Power Measurement and Analysis option (PWR) on an MSO68B oscilloscope, coupled with an AFG31000 Series arbitrary/function generator to perform the frequency sweep. Data was exported to CSV from the scope application and imported into Excel for plotting and analysis. In addition to the 6 Series B MSO, the PWR package is also available on 4 Series B MSO and 5 Series B MSO oscilloscopes.
I found published specs for the scope's (MSO68B) AC coupling mode roll-off of < 10Hz, so the measured 7 Hz is in line. Same for using a TPP1000, the low freq 3dB point should be <1Hz. I didn't find any low-frequency response specs for the TPR1000 or TDP1000 probes.
Recently, I had an application where a customer was mostly concerned about power rail noise in the <5Hz range. There were many conflicting choices for a solution. The TPP1000 in AC coupling mode had the low frequency covered, but the 10X attenuation was detrimental to the noise floor of the measurement. The P6247 in 1X mode historically has been a good choice for power rail noise, but its roll-off and also its legacy design being slightly noisier made it unacceptable.
The TPR1000 Power Rail Probe in DC Coupled mode worked well for the customer's < 5 Hz requirement, but one can see how choosing DC reject mode (as in Table 1) could give misleading results. A powerful feature of the TPR1000 is its large ( +/- 60 V) offset range, allowing it to zero out a wide range of DC in lieu of using DC Reject. It is also good to remember the TPR probes do load the AC portion of the signal differently than other probes.
Summary
Knowing the low-frequency response of your measurement system can be critical to many measurements, especially for power and noise applications.


