與我們聯絡
與 Tek 業務代表即時對談。 上班時間:上午 6:00 - 下午 4:30 (太平洋時間)
請致電
與 Tek 業務代表即時對談。 上班時間:上午 8:30 - 下午 5:30 (太平洋時間)
下載
下載手冊、產品規格表、軟體等等:
意見回饋
Advanced Power Measurement and Analysis
4/5/6 Series B MSO Option 4-PWR, 5-PWR, and 6-PWR Application Datasheet
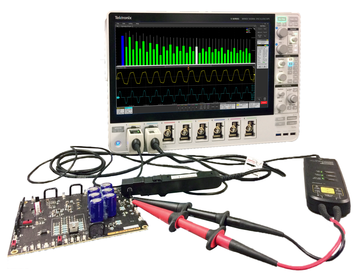
Get more visibility into your power systems with Advanced Power Measurement and Analysis on the 4/5/6 Series B MSO. The combination of the oscilloscope, analysis software, and a wide range of available voltage and current probes, enables you to perform automated, accurate power system measurements even if you are not a power conversion guru. The 12-bit analog-to-digital converters in these oscilloscopes deliver high-precision measurement data, and the pinch/swipe/zoom touch interface makes it easy to manage measurements. A rich set of graphical power analysis tools, high channel-counts, and large HD displays deliver a comprehensive view of your power system. The instruments support a wide range of voltage and current probes, including state-of-the-art IsoVu™ optically isolated voltage probes. The unmatched common mode rejection of IsoVu probes and the automation of Advanced Power Measurement and Analysis make an unbeatable combination for optimizing the latest GaN and SiC designs.
Key measurements
- Input measurements
- Power measures true power, apparent power, power factor, and phase angle
- Total Harmonic Distortion and Crest Factor measurements
- Harmonics measurements, bar charts, and tables
- Amplitude provides easy per-cycle measurements of voltage or current, including minimum, maximum, amplitude, and peak-to-peak
- Input Capacitance measures the capacitance value using voltage and current signals
- Inrush Current measures the peak current
- Switching Device measurements
- Switching Loss measures turn-on, turn-off, and conduction loss in switching devices
- Safe Operating Area (SOA) provides customizable safe operating area mask testing
- Timing Analysis enables easy analysis of pulse-width-modulated switching signals with cycle-by-cycle plots or histograms of pulse width, duty cycle, frequency, or period
- RDS(on) measures the dynamic resistance of the switching device when it is in the On state
- Magnetic Analysis measurements (available only in 4/5/6-PWR)
- Inductance measures inductance of the core
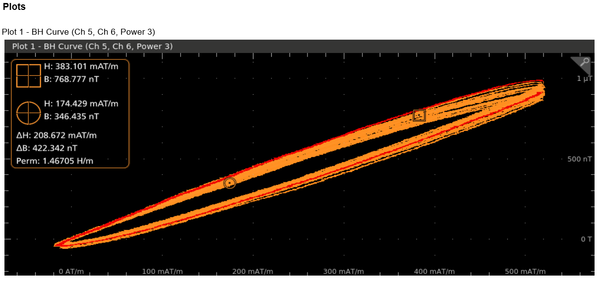
- Magnetic Property measures and plots the inductor B - H curve.
- Magnetic Loss measures and calculates total magnetic loss
- I vs. ∫V displays the plot of I and ∫V waveforms
- Output measurements
- Line Ripple measures the amount of AC signal related to the input line frequency.
- Switching Ripple measures the amount of AC signal related to the switching frequency.
- Efficiency measures the power circuit efficiency by dividing the measured output power by the measured input power
- Turn On Time measures the time delay between the input voltage to the device under test going 'high' to the output voltage reaching its steady state.
- Turn Off Time measures the time delay between the input voltage to the device under test going to zero state, to the output voltage reaching its zero state.
- Frequency response measurements(available only in 4/5/6-PWR)
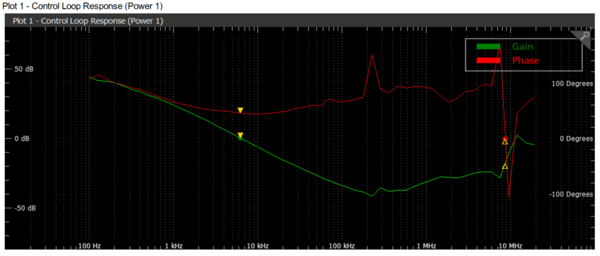
- Control Loop Response (Bode) plots the frequency and phase response of a closed loop circuit, and automatically calculates the gain and the phase margins.
- Power Supply Rejection Ratio (PSRR) analyzes the ripple rejection capability of a DC-DC converter.
- Impedance Analysis enables 2-port impedance measurement of Power Distribution Networks(PDN) using the oscilloscope.
Key features
- Add, configure, and remove automated measurements using the 4/5/6 Series B MSO’s pinch/swipe/zoom touch interface
- Easily document test results with automated report generation, including measurements, test results, and plots in a single, editable mht file or pdf file
- Utilizes optional and integrated Arbitrary/Function Generator for frequency response analysis (available only in 4/5/6-PWR). Also supports external AFG31000 Series function generator.
- Cover diverse applications with a wide range of voltage and current probes, including state-of-the-art IsoVu optically isolated voltage probes
- Configure any measurement and transfer any result via remote interface for automated testing applications
- Supports Save/Recall function of the session files for the FRA measurements
- Integrated Spectrum View analysis with Power FRA measurements
Input analysis
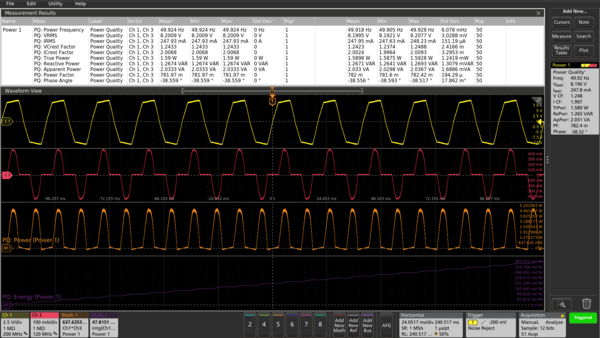
Power quality measurements, Current Harmonics, Input Capacitance, and Inrush Current are the four common sets of measurements made on the input section of a power supply, to analyze the effects of the power supply on the power line and evaluate the performance of the supply under various line conditions.
Power Quality
These measurements are optimized for line frequencies and are commonly performed at the AC line input of the power supply. They provide fast insight into the amount of power and the level of distortion at the input.
Measurements include:
RMS voltage and current
Frequency
True, apparent, and reactive power
Power factor
Crest factors of Voltage and Current
Harmonics
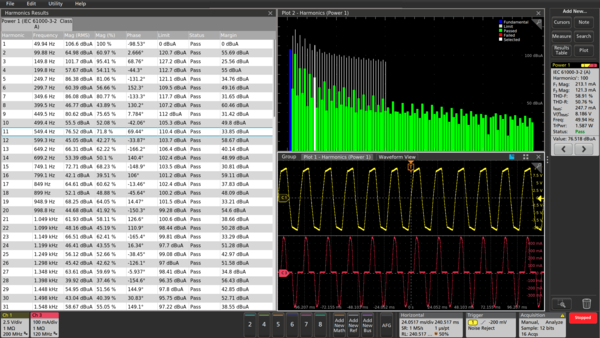
Any power supply with a non-linear device on its input (e.g. a rectifier) presents a nonlinear load to the AC line. Unless mitigated, excessive harmonic energy can affect the operation of other equipment connected to the power line and increase the cost of delivering the electric power. This has resulted in standards limiting harmonics generated by line-powered devices.
Advanced Power Measurement and Analysis include the test limits for IEC61000-3-2, AM 14, MIL- STD-1399, DO-160, and Custom standards. These standards help you perform pre-compliance testing before investing in official compliance testing. The Custom Limits will assist with upcoming new standards and designs when limits are still being defined. With the Custom option, you can set and modify the limits. Power Harmonics computes up to the 400th order harmonics and displays them as bar graphs and also in tabular formats. This lets you easily navigate between the table results and individual harmonics on the bar graph, act as a powerful debug step.
Input capacitance and Inrush current measurement
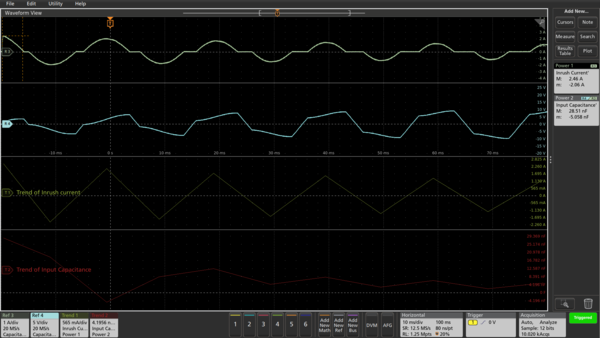
4-PWR-BAS, 4-PWR, 5-PWR, and 6-PWR provides peak inrush current and capacitance measurements for testing switching power supplies during operation.
Inrush current, input surge current or switch-on surge is the maximum, instantaneous input current drawn by an electrical device when first turned on. Power converters have inrush current that is more than their steady state current due to the charging current of input capacitance. Measuring inrush current and input capacitance is important to ensure the design works effectively.
Switching component analysis
The accurate calculation and evaluation of energy loss in power supplies has become even more critical with the drive toward higher power conversion efficiency and greater reliability.
Switching loss measurements
Although almost all components of a power supply contribute to energy losses, a significant portion of energy losses in a switch-mode power supply (SMPS) occur when the switching transistor transitions from a Turn-off (Toff) to a Turn-on (Ton) state and vice versa (Turn-off loss). By measuring the voltage drop across the switching device and the current flowing through the switching device, Advance Power Analysis automatically calculates switching loss measurement parameters for each cycle.
Until recently, taking switching measurements on the high side of half-bridge switching stages were almost impossible. Any measurement relative to the switching node, including high-side VDS and voltages across current shunts, suffered from distortion due to the significant common-mode voltage signal impinging on the differential signal. This problem is worse with wide bandgap devices, such as GaN and SiC transistors, as switching frequencies increase and the need to optimize new designs becomes imperative.
The 4/5/6 Series B MSO is designed to work with IsoVu optically isolated probes, enabling designers to perform accurate switching measurements even in the presence of high common mode signals. 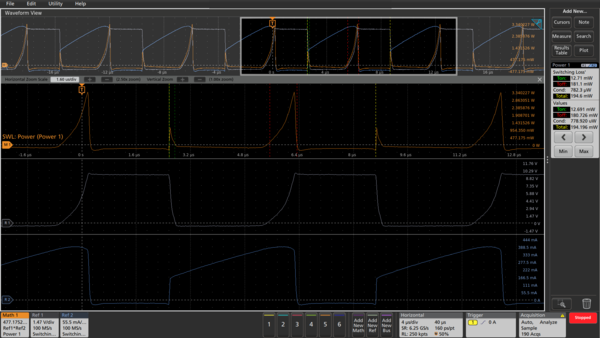
Switching loss measurements include special settings to produce stable, repeatable measurements on active power factor correction stages, and flyback converters.
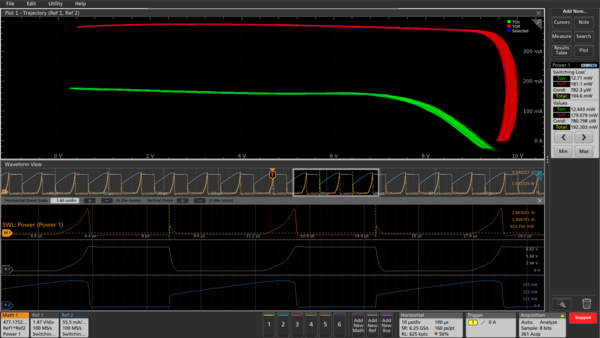
To get an overview of the switching loss for all captured cycles, you can use the trajectory plot. It automatically plots the voltage across the switch versus current through the switch during turn-on and turn-off, letting you judge the range of switching loss for all cycles at a glance.
Safe operating area
The Safe Operating Area (SOA) plot is a graphical technique for evaluating a switching device to ensure that it is not being stressed beyond its maximum specifications. SOA testing can be used to validate performance over a range of operating conditions, including load variations, temperature changes, and variations in input voltages. Mask testing can also be used with SOA plots to automate validation.

RDS(on)
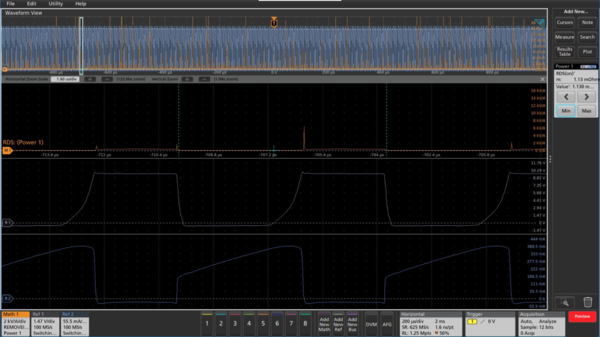
This measurement characterizes the resistance of the switching device during the conduction cycle, when the device is ON and conducting current. The dynamic-on-resistance is the ratio of the voltage across the device when it is turned ON to the current flowing through the device. The software ensures that the minimum RDSon value in the acquisition is highlighted and zoomed in for easy viewing. In addition, the traverse capability helps to move from cycle to cycle to the respective RDSon values.
Magnetic analysis (available only in 4/5/6-PWR)
Supports the following measurements:
- Inductance
- Magnetic property including BH curve
- Magnetic loss
- I vs. ʃV
Magnetic components are an important part of any power supply system. Inductors and transformers are used as energy storage devices in both switch-mode and linear power supplies. Some power supplies also use Inductors in filters at their output stage. Given their important role in the system, it is essential to characterize these magnetic components to determine the stability and overall efficiency of the power supply.
Inductance
Inductors exhibit increasing impedance as frequency increases, impeding higher frequencies more than lower frequencies. This behavior is known as inductance and is measured in units of Henries. The inductance can be measured automatically with Advanced Power Measurement and Analysis software.
Magnetic loss
An analysis of magnetic power losses is essential to accurately characterize the efficiency, reliability, and performance of a switching power supply. Advanced Power Measurement and Analysis software measures the inductive total magnetic power loss, as shown in the following figure.
Magnetic Property
This measurement computes the properties of the magnetic components including magnetic flux density (B), magnetic field intensity strength (H) and various loss components including Hysteresis Loss and Total Loss. This measurement also supports multiple secondary source configuration based on the scope channel count.
B-H plots
The properties of magnetic materials are described by the magnetic flux density (B), magnetic field intensity strength (H), and the magnetic permeability of a material (μ). B-H plots are often used to verify the saturation (or lack thereof) of the magnetic elements in a switching supply and provide a measure of the energy lost per cycle in a unit volume of core material. Advanced Power Measurement and Analysis software measures the voltage across the magnetic element and the current flowing through it, and plots B versus H, as shown in the following figure. You can test multiple secondary windings of a transformer simultaneously, thereby ensuring faster validation/testing times leading to faster time to market.
I vs. ∫V plot
I vs. ∫V plot provides insight to the B and H values, proportional to the voltage and current. This is the integral of the voltage and current waveforms in X-Y plot format as shown in the following figure.

Output analysis
The ultimate goal of a DC-output power supply is to transform input power into one or more DC output voltages. The most important output measurements for switching power supplies are line ripple and switching ripple.
Line and switching ripple
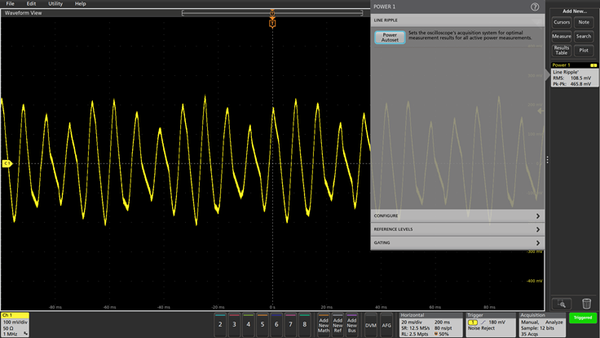
The quality of a power supply's DC output should be clean, with minimal AC noise and ripple. Advanced Power Measurements and Analysis software measures ripple to help you isolate the cause. Line ripple measurements indicate the amount of AC signal related to the input line frequency (since the input is rectified, line ripple is usually twice the frequency of the AC line). Switching ripple measures the amount of AC signal related to the switching frequency.
Efficiency
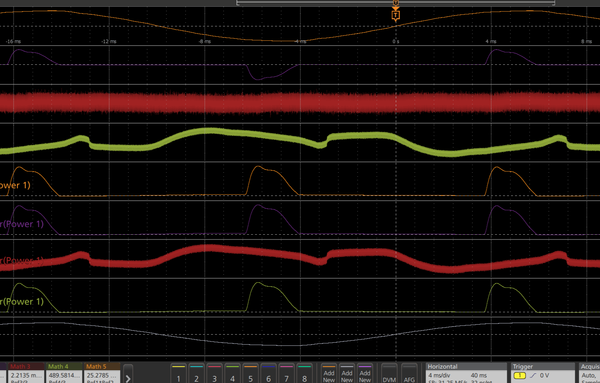
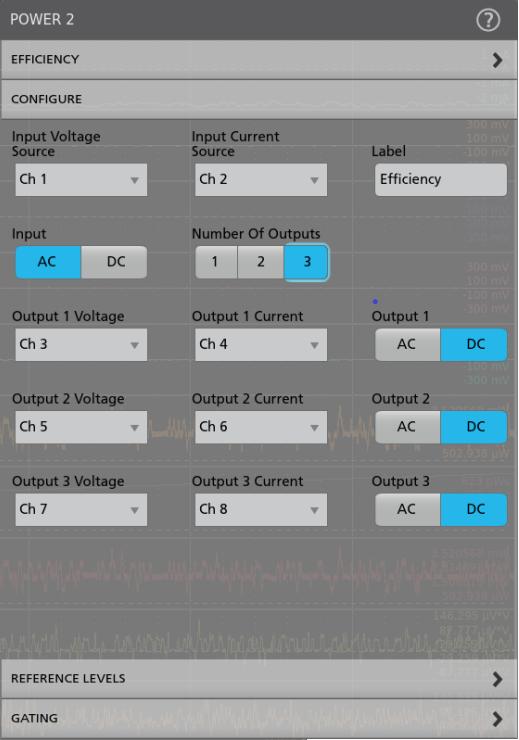
Device or product efficiency is a critical differentiator in today’s competitive environment. Advanced Power Measurements and Analysis software lets you easily measure your product's power conversion efficiency (AC-DC, AC-AC, DC-DC, DC-AC).
It allows you to test efficiency on multiple outputs at once, for faster testing and validation. You can configure each output independently.
Turn on time and turn off time
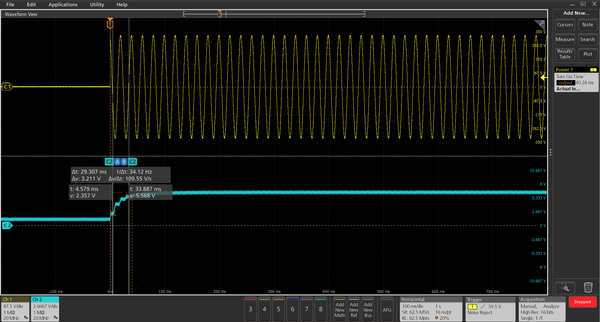
Turn on time is defined as the time it takes for the output voltage to reach a steady state after the input voltage is turned on.
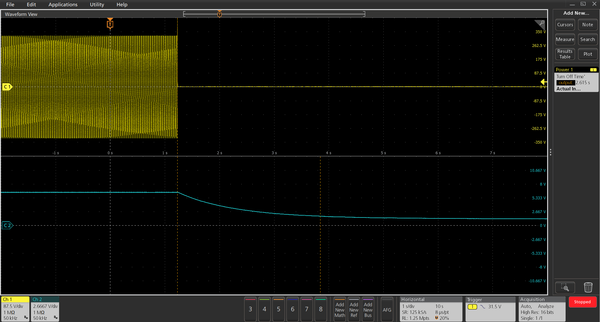
Turn off time is defined as the time it takes for the output to reach its zero state after the input voltage is switched off.
It is very important for SMPS to operate at specified turn on and turn off time. If the delay between mains power and SMPS startup is not as per design (typically 1 ms) it can disrupt the operation of some sensitive loads. Most embedded systems use more than one power supply and many use multiple outputs.
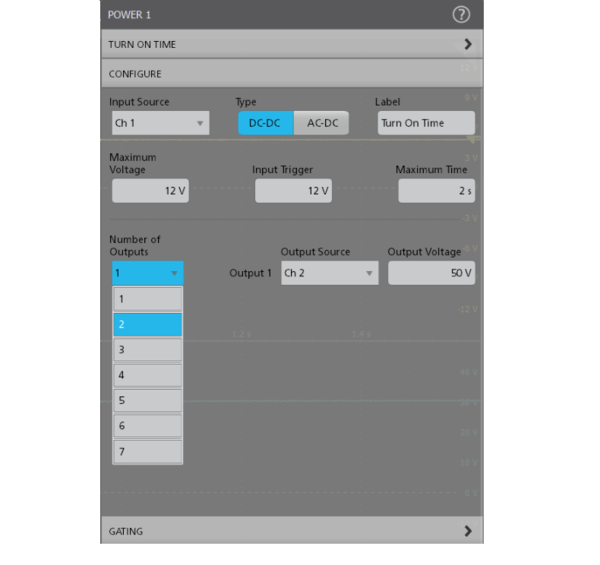
4-PWR-BAS, 4-PWR, 5-PWR, and 6-PWR automates this measurement for up to 5 outputs (4 Series MSO) or up to seven outputs (5 Series MSO or 6 Series B MSOs) or up to 3 outputs (6 Series MSO) simultaneously.

Frequency response analysis (available only in 4/5/6-PWR)
The Control Loop Response analysis (Bode plots), Power Supply Rejection Ratio (PSRR) and Impedance measurement provide key measurements to ensure stable, low-noise power supply designs. While it is possible to perform this analysis with a vector network analyzer or dedicated frequency response analyzer, these instruments can require significant setup time and long learning curves. Advanced Power Measurement and Analysis enables frequency response analysis right on the 4/5/6 Series B MSOs, taking advantage of the optional, built-in or external arbitrary/function generator.
These measurements leverage the built-in Spectrum View tool on the 4/5/6 Series B MSOs to get a finer frequency resolution across the various user-configurable frequency bands, and improve the accuracy of test results by analyzing the measurements in the frequency domain.
Control Loop Response (Bode plots)
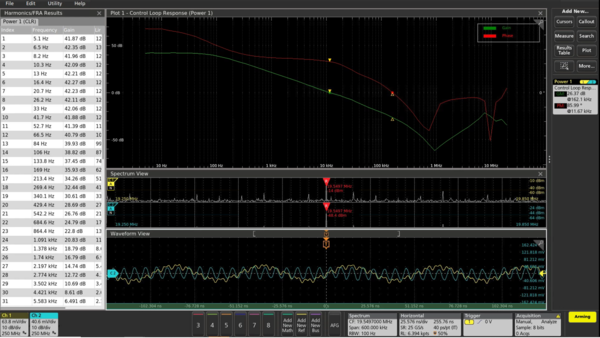
Bode plots and gain/phase margin measurements enable designers to determine the stability of a power supply control loop. Unstable control loops lead to oscillations and inefficient performance. Filter designers also use amplitude and phase plots to test filter designs.
Automated Control Loop Response measurements use the built-in AFG to provide a single source to sweep through a specified frequency range, plotting amplitude and phase at each point. Signals are introduced into the control loop using an injection transformer, such as the J21xxA models from Picotest. The resulting gain and phase plots (Bode plots) are used to automatically calculate gain and phase margins. Cursors allow you to view gain and phase values at any frequency on the curves.
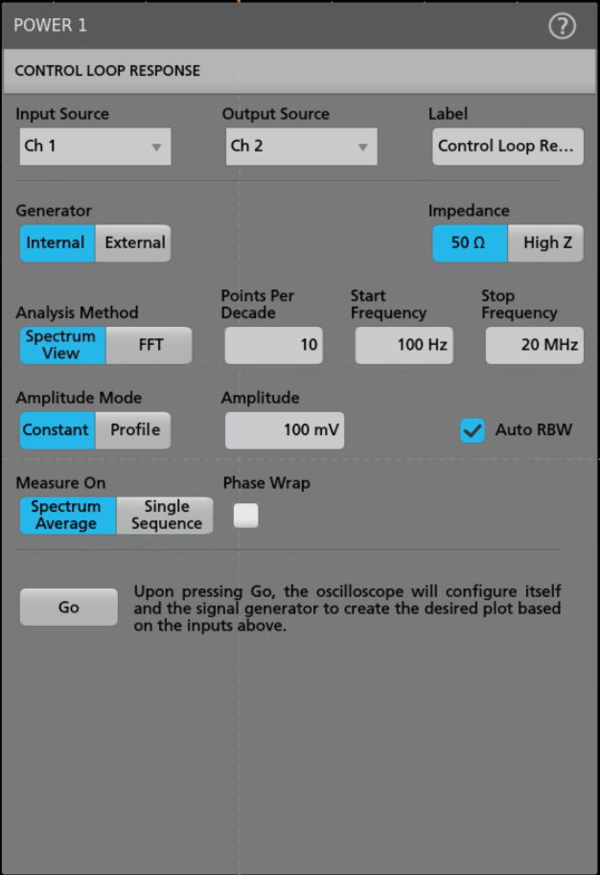
Control loop response measurement configuration allows user to set START and STOP frequencies, select constant/amplitude profile, impedance, phase wrap, and points per decade for better plot rendering.
Phase Wrap configuration allows you to unwrap the phase trace where it jumps more than the number of degrees set in the adjacent field. The default phase is set to 180°.
Power Supply Rejection Ratio (PSRR)
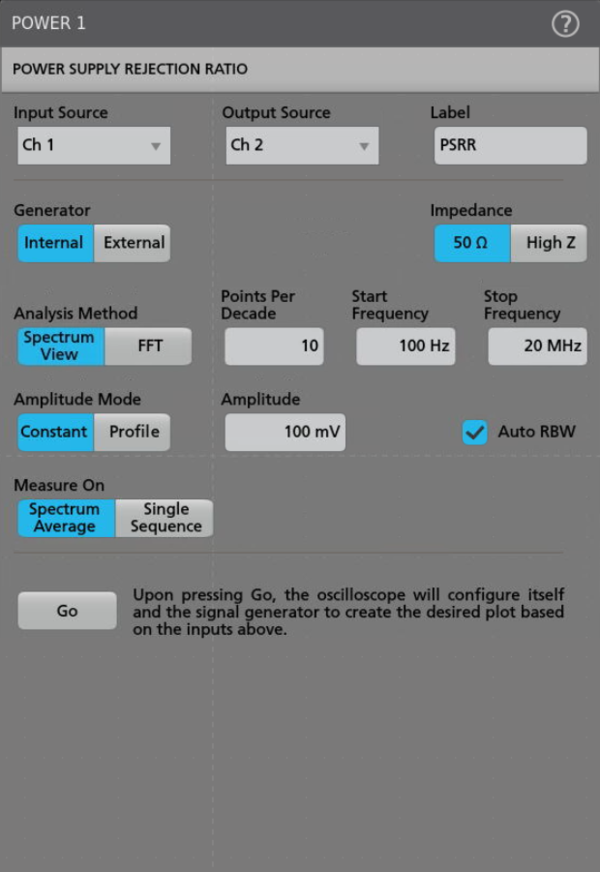
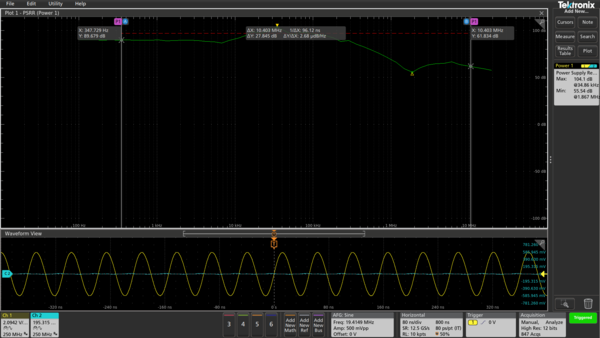
The PSRR measurements enable designers of DC-DC converters and regulators to quantify the ability of devices to attenuate AC over a specified frequency range. The test uses the optional, built-in function generator of the 4/5/6 Series B MSO or an external Tektronix AFG31000 function generator, along with an injection transformer (such as the Picotest J2120A Line Injector), to modulate the input to the regulator. The system automatically measures the AC voltage at both the modulated input and output. It calculates the rejection ratio as 20Log (Vin/Vout) at each frequency within the swept band, and plots the result.
Impedance
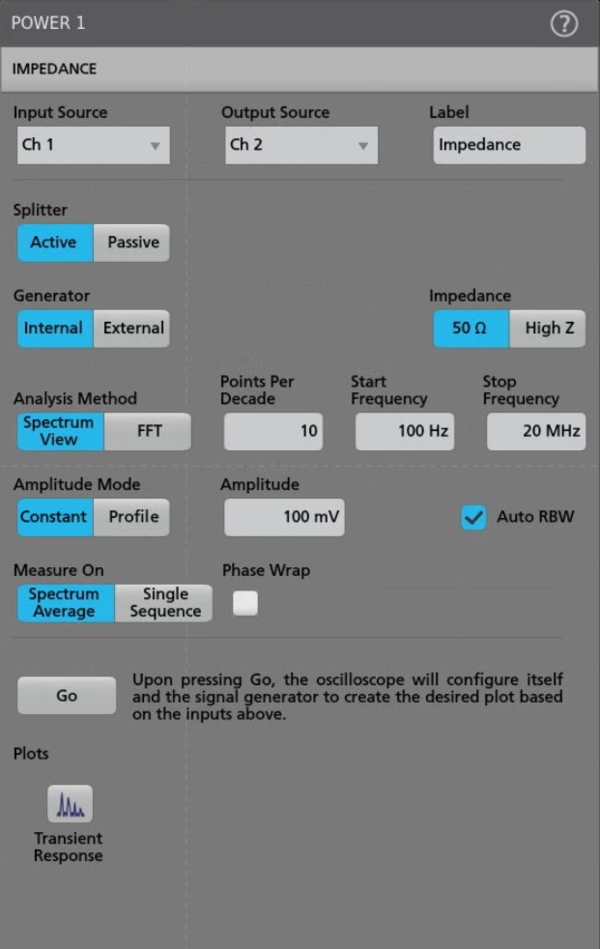
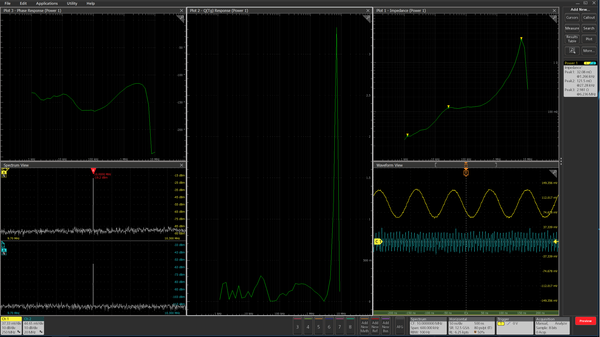
The 2-port impedance measurement enables designers to verify the impedance of their Power Distribution Network (PDN) over a specified frequency range. The test uses the optional built-in function generator of 4/5/6 Series B MSO or an external Tektronix AFG31000 Series function generator, along with an active splitter J2161A, and power supply J2170B, an injection transformer (such as the Picotest J2102B or J2113A line injector) to measure the impedance of the PDN network. The system automatically calculates the impedance at each frequency of the swept band, and plots the results. BNC or a direct SMA connection are recommended.
Smart probes deliver accurate results
Reducing noise and eliminating probing errors are among the best ways to improve the accuracy of power system measurements. The 4/5/6 Series B MSO and Advanced Power Measurement and Analysis software support a wide range of probes to help address different measurement needs, and include several features designed to help minimize probing problems.
The system uses voltage and current probes with the TekVPI interface which supports communication between probes and the scope. This allows the probe to communicate its scale setting automatically to the oscilloscope. On appropriate probes, it enables control of ranges from the front panel of the scope, and it allows probes to communicate error conditions such as a partially open jaw or a need for degaussing on current probes.
For timing-critical measurements such as switching loss, the analysis software can query voltage or current probes and use nominal delay values to remove timing skew and synchronize voltage and current waveforms for accurate and repeatable results.
The system is compatible with IsoVu Isolated Measurement Systems. These differential probing systems provide complete optical isolation, bandwidth up to 1 GHz, and extremely high common mode rejection, making them ideal for VGS, VDS or VSHUNT measurements in power systems. For optimizing designs that use wide bandgap switching devices such as GaN or SiC transistors, IsoVu probes are unbeatable.
Automated report generation
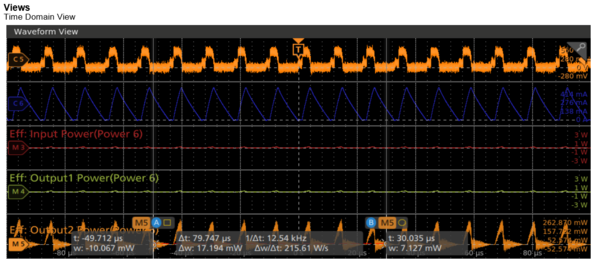
Data collection, archiving, and documentation can be tedious, but they are critical in the design and development process. 4-PWR-BAS, 4-PWR, 5-PWR, and 6-PWR analysis software includes an automated report generator to facilitate communication and record-keeping. Press a few buttons and generate a report showing all active measurements. Add plots or append additional tests to customize your reports. Reports are available as editable .mht files, or as .pdf files. A sample report is shown below.



Specifications
- Input analysis
- True power, Apparent power, Power factor, Reactive power, Crest factor, Phase angle, THD, Harmonics, Input capacitance, Inrush current, D0-160G, Pre-compliance testing for EN61000-3-2, EN61000-3-2 AM14, and MIL-STD-1399 (400 Hz) standards
- Amplitude measurements
- Cycle Amplitude, Cycle Top, Cycle Base, Cycle Minimum, Cycle Maximum, and Cycle Peak-to-Peak
- Timing analysis
- Pulse width, Duty cycle, Period, and Frequency variation versus time
- Switching analysis
- Switching loss, Turn-on (Ton), Turn -off (Toff), Conduction loss (cond), Safe operating area (SOA), SOA with Mask testing, di/dt, dv/dt, and RDS(on)
- Magnetic analysis
- Magnetic analysis (available only in 4/5/6-PWR)1 Inductance, Magnetic Property, Magnetic Loss (Hysteresis Loss, Total Loss), and I vs.∫V
- Output analysis
- Ripple (line frequency, switching frequency), Efficiency, Turn On Time, Turn Off Time
- Frequency response analysis (available only in 4/5/6-PWR)1
Bode and PSSR
Control Loop Response (Bode plot) and Power Supply Rejection Ratio (PSRR).
PSRR plots rejection ratio vs frequency. Control Loop Response (Bode plot) calculates gain and phase margin.
Requires and recommended TPP0502, two probes. Uses oscilloscope built-in generator or external Tektronix AFG 31000 Series.
Measurements can be made using TDP probes.
Dynamic range: Bode is typically 55 dB and PSRR is typically 85 dB.
Frequency: 10 Hz to 50 MHz (with option AFG).
1 Hz in case of Spectrum View method.
10 Hz to maximum sine frequency (with AFG31000 Series)
Amplitude: up to 5 V (needs Option AFG or external AFG31000 Series 10V p-p).
Requires Picotest isolation and injector transformers.
Impedance Measurement
Impedance: Requires a BNC or Direct SMA cable with DC block.
Frequency: 10 Hz to 50 MHz for internal AFG and 10 Hz to max of AFG31000 Series in case of external.
Minimum Impedance can be measured is 10 milli Ohm and maximum is 47 Ohms
- Plots
- Time trend, Trajectory plot, Histogram, Bar graph, B-H curve, Inductance plot, I vs. ∫V, Phase, Gain, and Rejection ratio plots.
- Report
- MHT and PDF format, Data export to CSV format
- Degauss/Deskew (static)
- Automatic detection of probes, Auto Zero. User can deskew probes from the menus for each channel
- Source support
- Live analog signals, reference waveforms, and math waveforms
Ordering information
Models
| Product | Options | Supported instruments |
|---|---|---|
| New Instrument order option | 4-PWR-BAS, 4-PWR, 4-PS2 5-PWR, 5-PS2, 5-PS2FRA 6-PWR, 6-PS2, 6-PS2FRA | 4 Series MSO (MSO44, MSO46) 4 Series B MSO (MSO44B, MSO46B) 5 Series MSO (MSO54, MSO56, MSO58, MSO58LP) 5 Series B MSO (MSO54B, MSO56B, MSO58B) 6 Series MSO (MSO64) 6 Series B MSO (MSO64B, MSO66B, MSO68B) |
| Product upgrade option | SUP4-PWR-BAS, SUP4-PWR SUP5-PWR SUP6-PWR | |
Floating license | SUP4-PWR-BAS-FL, SUP4-PWR-FL SUP5-PWR-FL SUP6-PWR-FL | 4 Series B MSO (MSO44B, MSO46B) Floating licenses are transferrable from any 4 Series oscilloscope to any other 4 Series oscilloscope, for use of one instrument at a time. 5 Series B MSO (MSO54B, MSO56B, MSO58B, MSO58LP) Floating licenses are transferrable from any 5 Series oscilloscope to any other 5 Series oscilloscope, for use of one instrument at a time. 6 Series B MSO (MSO64B, MSO66B, MSO68B) Floating licenses are transferrable from any 6 Series oscilloscope to any other 6 Series oscilloscope, for use of one instrument at a time. |
Additional information about power analysis is available at http://www.tek.com/application/power-supply-measurement-and-analysis.
Software Bundles
| Bundle Options | Supported Instruments | Description |
|---|---|---|
| 4-PRO-POWER-1Y | 4 Series B MSO | 1 Year License Pro Power Bundle for 4 Series B MSO |
| 4-PRO-POWER-PER | Perpetual License Pro Power Bundle for 4 Series B MSO | |
| 4-ULTIMATE-1Y | 1 Year License Ultimate Bundle for 4 Series B MSO | |
| 4-ULTIMATE-PER | Perpetual License Ultimate Bundle for 4 Series B MSO | |
| 5-PRO-POWER-1Y | 5 Series B MSO | 1 Year License Pro Power Bundle for 5 Series B MSO |
| 5-PRO-POWER-PER | Perpetual License Pro Power Bundle for 5 Series B MSO | |
| 5-ULTIMATE-1Y | 1 Year License Ultimate Bundle for 5 Series B MSO | |
| 5-ULTIMATE-PER | Perpetual License Ultimate Bundle for 5 Series B MSO | |
| 6-PRO-POWER-1Y | 6 Series B MSO | 1 Year License Pro Power Bundle for 6 Series B MSO |
| 6-PRO-POWER-PER | Perpetual License Pro Power Bundle for 6 Series B MSO | |
| 6-ULTIMATE-1Y | 1 Year License Ultimate Bundle for 6 Series B MSO | |
| 6-ULTIMATE-PER | Perpetual License Ultimate Bundle for 6 Series B MSO |
Recommended probes and accessories
| Accessory type | Recommended |
|---|---|
| AC/DC current probes | TCP0020, TCP0030A, TCP0150 |
| AC current probes | TRCP0300, TRCP0600, TRCP3000 |
| Medium-voltage differential probes | TDP0500, TDP1000 |
| High-voltage differential probes | THDP0200, THDP0100, TMDP0200 |
| IsoVu isolated differential probes | TIVM1/L, TIVH08/L, TIVH05/L, TIVH02/L |
| High-voltage passive probes | P5100A, P6015A |
| Deskew pulse generator | TEK-DPG |
| Power solution bundles | 4-PS2 5-PS2, 5-PS2FRA 6-PS2, 6-PS2FRA |
Deskew fixture | 067-1686-xx |
Probes for frequency response analysis (supported only in 4/5/6-PWR) | TPP0502: Two probes (For Control Loop Response, and PSSR measurements) For Impedance measurement
|
Accessories for frequency response analysis (supported only in 4/5/6-PWR) | Picotest Line injector J2120A for PSRR (10 Hz to 10 MHz) Picotest Isolation transformers (for Bode) http://picotest.com:
Picotest transformers (for Impedance):
|
Power solution bundles
| 4/5/6 Series B MSO PS bundle options | Description |
|---|---|
| 4-PS2 | 4-PWR, TCP0030A, THDP0200, 067-1686-xx deskew fixture |
| 5-PS2 | 5-PWR, TCP0030A, THDP0200, 067-1686-xx deskew fixture |
| 6-PS2 | 6-PWR, TCP0030A, THDP0200, 067-1686-xx deskew fixture |
| 5-PS2FRA | 5-PS2, two TPP0502 probes |
| 6-PS2FRA | 6-PS2, two TPP0502 probes |
Complete power probing portfolio
Use the following list of probes with option 4-PWR-BAS, 4-PWR/5-PWR/6-PWR power to ensure complete solution to power measurement capabilities on the 4/5/6 Series B MSO oscilloscopes.
| Probe type | Description | |
|---|---|---|
High voltage differential probes | The THDP0100/THDP0200/TMDP0200 high-voltage differential probes are the best choice for making non-ground referenced, floating measurements. These probes provide bandwidths to 200 MHz and voltage ranges up to 6000 V. | 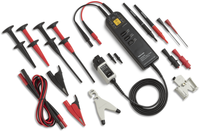 |
The P5200A/P5202A/P5205A/P5210A high-voltage differential probes are the best choice for making non-ground referenced, floating or isolated measurements. These probes provide bandwidths to 100 MHz and voltage ranges up to 5600 V. | 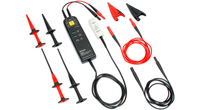 | |
Optically Isolated differential probes | The TIVM1, TIVH08, TIVH05, and TIVH02 optically-isolated differential probes are the best choice for accurately resolving high bandwidth, differential signals, ideal for testing wide bandgap designs. The probes are available in 3 m and 10 m lengths. The TIVM1 provides 1 GHz bandwidth and can measure differential signals up to ±50 Vpk in the presence of common mode voltages up to 60 kV. The TIVH08, TIVH05, and TIVH02 provide 800 MHz, 500 MHz, and 200 MHz, respectively, and can measure differential signals up to ±2500 Vpk in the presence of common mode voltages up to 60 kV. | 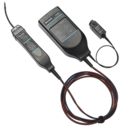 |
Current probes | Tektronix offers a broad portfolio of current probes, including AC/DC current probes that provide bandwidths up to 120 MHz and best-in-class current clamp sensitivity down to 1 mA. | 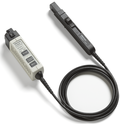 |
| AC-only Rogowski probes include the TRCP300 (9 Hz to 30 MHz, 250 mA to 300 A peak), TRCP600 (12 Hz to 30 MHz, 500 mA to 600 A peak), and TRCP3000 (1 Hz to 16 MHz, 500 mA to 3000 A peak). | 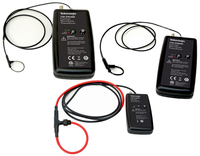 | |
Mid-voltage differential probes | The TDP0500/TDP1000 medium-voltage differential probes are the best choice for making non-ground referenced, floating or isolated measurements. These probes provide bandwidths to 1 GHz and voltage ranges up to ±42 V (DC + pk AC). | 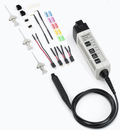 |
Probes for control loop analysis and power supply rejection ratio | TPP0502 is the recommended passive probe FRA measurement. It has the attenuation of 2X and bandwidth of 500 MHz. It also offers low capacity loading. | 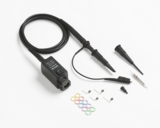 |
Probes for Impedance measurement | BNC or Direct SMA cable with DC Block are the recommended probes for Impedance measurement. The TPR1000 and TPR4000 probes provide a low-noise measurement solution (oscilloscope and probe), which is critical to not confuse the noise of the oscilloscope and probe with the noise and ripple of the measured DC supply. The higher input impedance in the probes minimizes the oscilloscope loading effect on the DC rails (50 kΩ at DC). These probes are used for Impedance testing as an alternative. |  |
For a complete listing of compatible probes for each oscilloscope, please refer to http://www.tek.com/probes for specific information on the recommended models of probes and any necessary probe adapters.


