與我們聯絡
與 Tek 業務代表即時對談。 上班時間:上午 6:00 - 下午 4:30 (太平洋時間)
請致電
與 Tek 業務代表即時對談。 上班時間:上午 8:30 - 下午 5:30 (太平洋時間)
下載
下載手冊、產品規格表、軟體等等:
意見回饋
RSA5000 Series Spectrum Analyzers Datasheet
Tektronix 不再銷售此產品規格表上的產品。
檢視 Tektronix Encore 以取得檢修測試設備。
檢查這些產品的支援和保固狀態。

The RSA5000 Series Real Time Signal Analyzers replace conventional instruments, offering the measurement confidence and functionality you demand for everyday tasks. The RSA5000 Series offers industry-leading real time specifications and includes best minimum signal duration for 100% probability of intercept and best real time dynamic range. With the RSA5000 Series instruments, you get the functionality of a high-performance spectrum analyzer, wideband vector signal analyzer, and the unique trigger-capture-analyze capability of a real-time spectrum analyzer – all in a single package.
Key performance specifications
- +17 dBm 3rd order intercept at 2 GHz
- ±0.3 dB absolute amplitude accuracy to 3 GHz
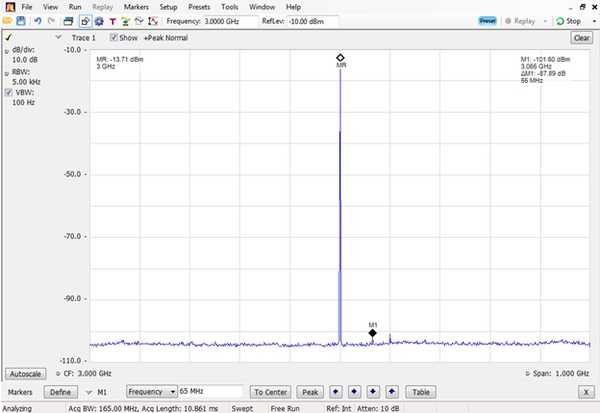
- Displayed average noise level: –142 dBm/Hz at 26.5 GHz, –157 dBm/Hz at 2 GHz and –150 dBm/Hz at 10 kHz
- Internal Preamp available: DANL of -156 dBm/Hz at 26.5 GHz, -167 dBm/Hz at 2 GHz
- Phase noise: –113 dBc/Hz at 1 GHz and –134 dBc/Hz at 10 MHz carrier frequency, 10 kHz offset
- High-speed sweeps with high resolution and low noise: 1 GHz sweeps at 10 kHz RBW in <1 second
- Real time spurious free dynamic range of 80 dB with HD options
Key features
- Reduce Time-to-Fault and increase design confidence with Real-time Signal Processing
- Up to 3,125,000 spectrums per second, enables 100% probability of intercept for signals of 0.434 μs
- Swept DPX spectrum enables unprecedented signal discovery over full frequency range
- Advanced DPX including swept DPX, gap-free DPX spectrograms, and DPX zero span with real-time amplitude, frequency, or phase
- Triggers zero in on the Problem
- DPX density™ trigger on single occurrences as brief as 0.434 μs in frequency domain and distinguish between continuous signals vs infrequent events
- Advanced time-qualified, runt, and frequency-edge triggers act on complex signals as brief as 20 ns
- Capture the widest and deepest signals
- 25, 40, 85, 125, or 165 MHz acquisition bandwidths
- Spurious-free dynamic range of 80 dB over the entire acquisition bandwidth with HD options
- Acquire more than 5 seconds at 165 MHz bandwidth
- Wideband preselection filter provides image free measurements in entire analysis bandwidth up to 165 MHz
- More standard analysis than you expect in an everyday tool
- Measurements including channel power, ACLR, CCDF, OBW/EBW, spur search, EMI detectors
- Amplitude, frequency, phase vs. time, DPX spectrum, and spectrograms
- Correlated multi-domain displays
- Performance options for best real time and dynamic range and analysis options offer added value
- High dynamic range options offer unmatched 80 dBc spurious-free analysis in the widest acquisition bandwidth
- High performance DPX offers industry-leading minimum signal duration for 100% probability of intercept
- Optional software applications to add dedicated measurements for specific applications and standards
- AM/FM/PM modulation and audio measurements (Opt. 10)
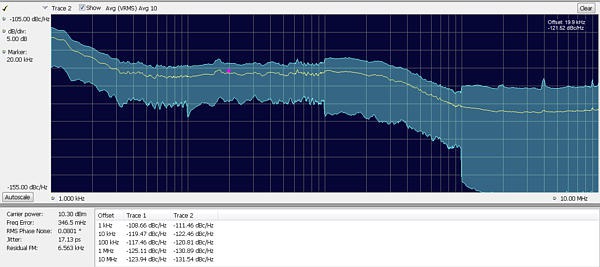
- Phase noise and jitter (Opt. 11)
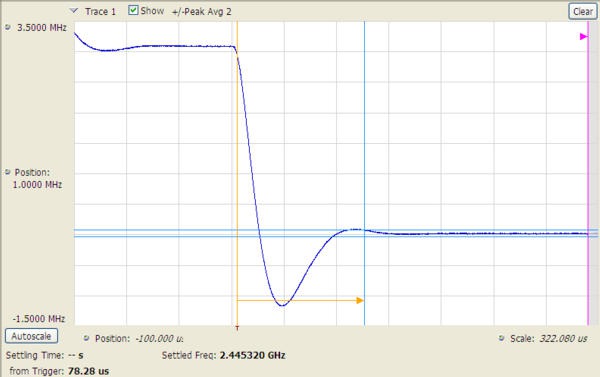
- Automated settling time measurements (frequency and phase) (Opt. 12)
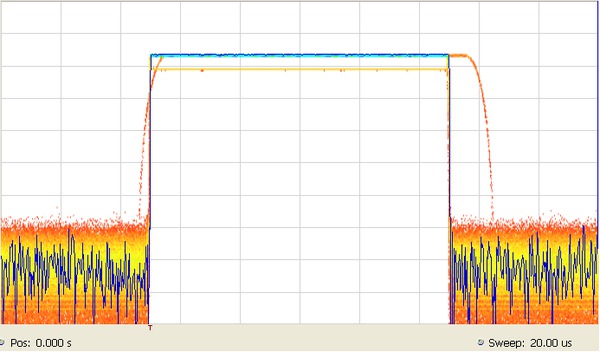
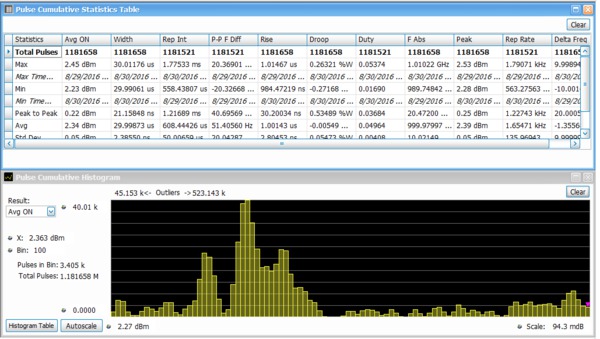
- More than 30 pulse measurements, acquisition of more than 200,000 pulses possible for post analysis and cumulative statistics. (Opt. 20)
- General purpose modulation analysis of more than 20 modulation types (Opt. 21)
- Simple and complete APCO Project 25 transmitter compliance testing and analysis for Phase 1 (C4FM) and Phase 2 (TDMA) (Opt. 26)
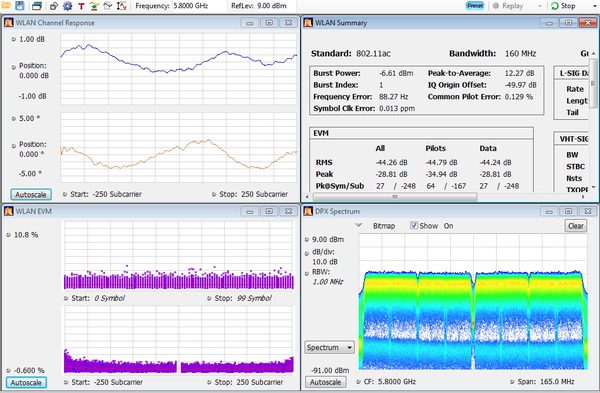
- WLAN analysis for 802.11 a/b/g/j/p, 802.11n, and 802.11ac (Opts. 23, 24, 25)
- Noise figure and gain measurements (Opt. 14)
- Bluetooth® Analysis (Opt. 27 and Opt. 31)
- Manual and automatic measurement mapping plus signal strength function provides audio tone and visual indication of received signal strength (Opt. MAP)
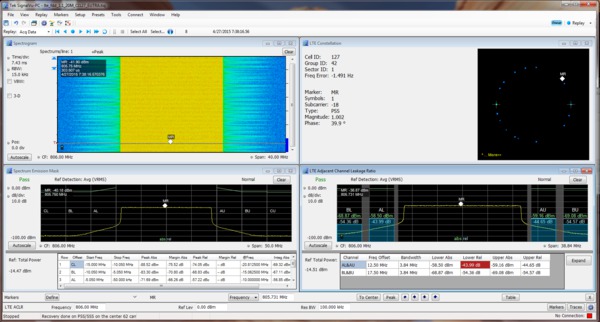
- LTE™ FDD and TDD Base Station (eNB) Transmitter RF measurements (Opt. 28)
- The 5G NR analysis is supported on Windows 10 (RSA5BUP Opt. 5GNR)
- Signal Classification and Survey
- EMC/EMI pre-compliance and troubleshooting (Opt. 32)
Applications
- Wideband radar and pulsed RF signals
- Frequency agile communications
- Broadband satellite and microwave backhaul links
- Education
- Long Term Evolution (LTE), Cellular
- 5G NR Cellular base station or user equipment transmitter test
- EMC/EMI pre-compliance and troubleshooting
High performance spectrum and vector signal analysis, and much more
The RSA5000 Series replaces conventional high-performance signal analyzers, offering the measurement confidence and functionality you demand for everyday tasks. A +17 dBm TOI and -157 dBm/Hz DANL at 2 GHz gives you the dynamic range you expect for challenging spectrum analysis measurements. All analysis is fully preselected and image free. You never have to compromise between dynamic range and analysis bandwidth by 'switching out the preselector'.
A complete toolset of power and signal statistics measurements are standard, including Channel Power, ACLR, CCDF, Occupied Bandwidth, AM/FM/PM, and Spurious measurements. Available Phase Noise and General Purpose Modulation Analysis measurements round out the expected set of high-performance analysis tools.
But, just being an excellent mid-range signal analyzer is not sufficient to meet the demands of today's hopping, transient signals.
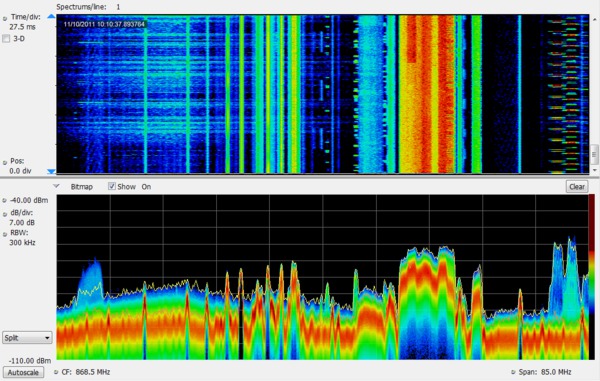
The RSA5000 Series will help you to easily discover design issues that other signal analyzers may miss. The revolutionary DPX® spectrum display offers an intuitive live color view of signal transients changing over time in the frequency domain, giving you immediate confidence in the stability of your design, or instantly displaying a fault when it occurs. Once a problem is discovered with DPX®, the RSA5000 Series spectrum analyzers can be set to trigger on the event, capture a contiguous time record of changing RF events, and perform time-correlated analysis in all domains. You get the functionality of a high-performance spectrum analyzer, wideband vector signal analyzer, and the unique trigger-capture-analyze capability of a real-time spectrum analyzer - all in a single package.
Discover
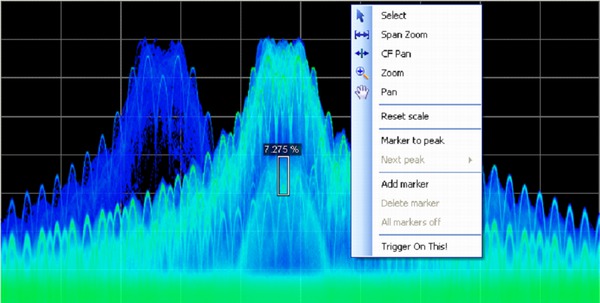
The patented DPX® spectrum processing engine brings live analysis of transient events to spectrum analyzers. Performing up to 3,125,000 frequency transforms per second, transients of a minimum event duration of 0.434 μs in length are displayed in the frequency domain. This is orders of magnitude faster than swept analysis techniques. Events can be color coded by rate of occurrence onto a bitmapped display, providing unparalleled insight into transient signal behavior. The DPX spectrum processor can be swept over the entire frequency range of the instrument, enabling broadband transient capture previously unavailable in any spectrum analyzer. In applications that require only spectral information, DPX provides gap-free spectral recording, replay, and analysis of up to 60,000 spectral traces. Spectrum recording resolution is variable from 125 µs to 6400 s per line.
Trigger
Tektronix has a long history of innovative triggering capability, and the RSA Series spectrum analyzers lead the industry in triggered signal analysis. The RSA5000 Series provides unique triggers essential for troubleshooting modern digitally implemented RF systems, including time-qualified power, runt, density, frequency, and frequency mask triggers.
Time qualification can be applied to any internal trigger source, enabling capture of 'the short pulse' or 'the long pulse' in a pulse train, or, when applied to the Frequency Mask Trigger, only triggering when a frequency domain event lasts for a specified time. Runt triggers capture troublesome infrequent pulses that either turn on or turn off to an incorrect level, greatly reducing time to fault.
DPX Density™ Trigger works on the measured frequency of occurrence or density of the DPX display. The unique Trigger On This™ function allows the user to simply point at the signal of interest on the DPX display, and a trigger level is automatically set to trigger slightly below the measured density level. You can capture low-level signals in the presence of high-level signals at the click of a button.
The Frequency Mask Trigger (FMT) is easily configured to monitor all changes in frequency occupancy within the acquisition bandwidth.
A Power Trigger working in the time domain can be armed to monitor for a user-set power threshold. Resolution bandwidths may be used with the power trigger for band limiting and noise reduction. Two external triggers are available for synchronization to test system events.
Capture
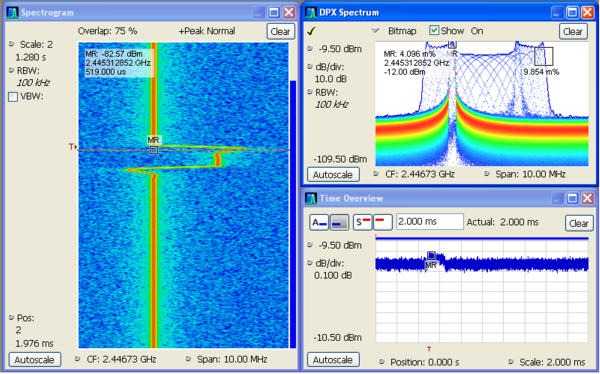
Real-time capture of small signals in the presence of large signals is enabled with greater than 70 dB SFDR in all acquisition bandwidths, even up to 165 MHz (Opt. B16x). The dynamic range of the wideband acquisition system can be improved to an unmatched 80 dB with the B85HD, B125HD, and B16xHD options. Capture once - make multiple measurements without recapturing. All signals in an acquisition bandwidth are recorded into the RSA5000 Series deep memory. Record lengths vary depending upon the selected acquisition bandwidth - up to 5.36 seconds at 165 MHz, 343.5 seconds at 1 MHz, or 6.1 hours at 10 kHz bandwidth with Memory Extension (Opt. 53). Acquisitions of up to 2 GB in length can be stored in MATLAB™ Level 5 format for offline analysis.
Most spectrum analyzers use narrowband tunable band pass filters, often YIG tuned filters (YTF) to serve as a preselector. These filters provide image rejection and improve spurious performance in swept applications by limiting the number of signals present at the first mixing stage. YTF's are narrow band devices by nature and are usually limited to bandwidths less than 50 MHz. These analyzers bypass the input filter when performing wideband analysis, leaving them susceptible to image responses when operating in modes where wideband analysis is required such as for real time signal analysis.
Unlike spectrum analyzers with YTF's, Tektronix Real Time Signal Analyzers use a wideband image-free architecture guaranteeing that signals at frequencies outside of the band to which the instrument is tuned don't create spurious or image responses. This image-free response is achieved with a series of input filters designed such that all image responses are suppressed. The input filters are overlapped by greater than the widest acquisition bandwidth, ensuring that full-bandwidth acquisitions are always available. This series of filters serves the purpose of the preselector used by other spectrum analyzers, but has the benefit of always being on while still providing the image-free response in all instrument bandwidth settings and at all frequencies.
Analyze
The RSA5000 Series offers analysis capabilities that advance productivity for engineers working on components or in RF system design, integration, and performance verification, or operations engineers working in networks, or spectrum management. In addition to spectrum analysis, spectrograms display both frequency and amplitude changes over time. Time-correlated measurements can be made across the frequency, phase, amplitude, and modulation domains. This is ideal for signal analysis that includes frequency hopping, pulse characteristics, modulation switching, settling time, bandwidth changes, and intermittent signals.
The measurement capabilities of the RSA5000 Series and available options and software packages are summarized in the following section.
5G NR modulation analysis and measurements option
5G NR is among the growing set of signal standards, applications, and modulation types supported by Vector Signal Analysis (VSA) software. The VSA 5G NR analysis option provides comprehensive analysis capabilities in the frequency, time, and modulation domains for signals based on the 3GPP’s 5G NR specification.
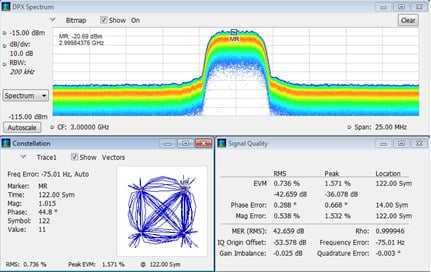
By configuring result traces of spectrum, acquisition time, and NR specific modulation quality (e.g, EVM, frequency error, I/Q error) traces and tables, engineers can identify overall signal characteristics and troubleshoot intermittent error peaks or repeated synchronization failures.
Error Vector Magnitude (EVM) is a figure of merit used to describe signal quality. It does this by measuring the difference on the I/Q plane between the ideal constellation point of the given symbol versus the actual measured point. It can be measured in dB or % of the ideal sub-symbol, normalized to the average QAM power received, and display constellation of symbols vs ideal symbol. The EVM vs Symbol or EVM vs Time gives the EVM of OFDM symbols present in the number of symbols considered or the time within a slot.
For automated testing, SCPI remote interfaces are available to accelerate design, which enables the quick transition to the design verification and manufacturing phases.

5G NR transmitter measurements core supported features
5G NR option (RSA5BUP Opt. 5GNR) supports 5G NR modulation analysis measurements according to Release 15 and Release 16 of 3GPP’s TS38 specification, including:
- Analysis of uplink and downlink frame structures
- 5G NR measurements and displays including
- Modulation Accuracy (ModAcc)
- Channel Power (CHP)
- Adjacent Channel Power (ACP)
- Spectrum Emission Mask (SEM)
- Occupied Bandwidth (OBW)
- Power Vs Time (PVT)2
- Error Vector Magnitude (EVM)
- Summary table with all scalar results for ModAcc, SEM, CHP, ACP, OBW, PVT, and EVM measurements
- In-depth analysis and troubleshooting with coupled measurements across domains, use multiple markers to correlate results to find root-cause.
- Saves reports in CSV format with configuration parameters and measurement results
- Configurable parameters of PDSCH or PUSCH for each component carrier
- For downlink, supported test models for FDD and TDD per 3GPP specifications
Measurement functions
| Standard measurements | Description |
|---|---|
| Spectrum analyzer measurements | Channel power, Adjacent channel power, Multicarrier adjacent channel power/leakage ratio, Spectrum emissions mask, Occupied bandwidth, xdB down, dBm/Hz marker, dBc/Hz marker |
| Real time measurements | DPX Spectrum with density measurements, DPX Spectrogram with spectrums vs. time, Zero-Span DPX with up to 50,000 updates/sec |
| Time domain and statistical measurements | RF IQ vs Time, Power vs Time, Frequency vs Time, Phase vs Time, CCDF, Peak-to-Average Ratio |
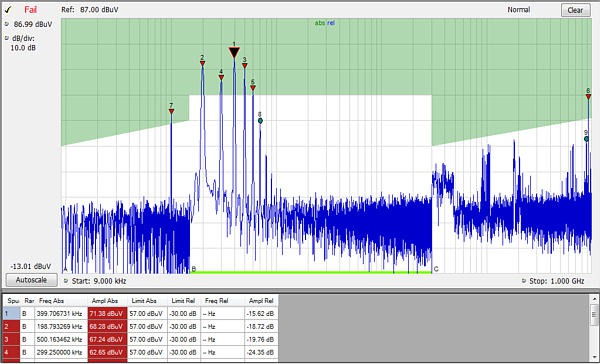
| Spur search measurement | Up to 20 frequency ranges, user-selected detectors (Peak, Average, QP), filters (RBW, CISPR, MIL), and VBW in each range. Linear or log frequency scale. Measurements and violations in absolute power or relative to a carrier. Up to 999 violations identified in tabular form for export in .CSV format |
| Analog modulation analysis measurement functions | % amplitude modulation (+, -, total) frequency modulation (±Peak, +Peak, -Peak, RMS, Peak-Peak/2, frequency error) phase modulation (±Peak, RMS, +Peak, -Peak) |
| DPX density measurement | Measures % signal density at any location on the DPX spectrum display and triggers on specified signal density |
| Measurement options | Description |
|---|---|
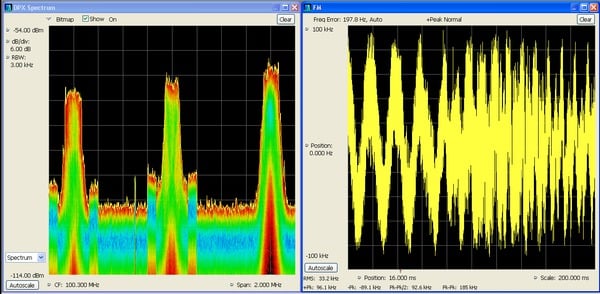
| AM/FM/PM modulation and audio measurements (Opt. 10) | carrier power, frequency error, modulation frequency, modulation parameters (±Peak, Peak-Peak/2, RMS), SINAD, modulation distortion, S/N, THD, TNHD |
| Phase noise and jitter measurements (Opt. 11) | 10 Hz to 1 GHz frequency offset range, log frequency scale traces - 2: ±Peak trace, average trace, trace smoothing, and averaging |
| Settling Time (Frequency and Phase) (Opt. 12) | Measured frequency, Settling time from last settled frequency, Settling time from last settled phase, Settling time from trigger. Automatic or manual reference frequency selection. User-adjustable measurement bandwidth, averaging, and smoothing. Pass/Fail mask testing with 3 user-settable zones |
| Noise Figure and Gain measurements (Opt. 14) | Measurement displays of noise figure, gain, Y-factor, noise temperature, and tabular results. Single-frequency metering and swept-trace results are available. Support for industry-standard noise sources. Measures amplifiers and other non-frequency converting devices plus fixed local-oscillator up and down converters. Performs mask testing to user-defined limits. Built in uncertainty calculator. |
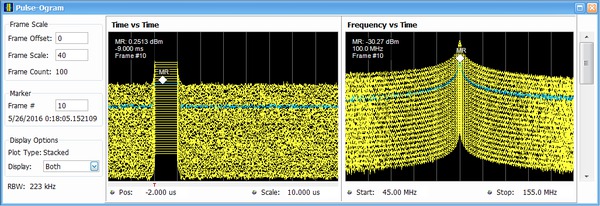
| Advanced pulse measurements suite (Opt. 20) | Pulse-Ogram™ waterfall display of multiple segmented captures, with amplitude vs time and spectrum of each pulse. Pulse frequency, Delta Frequency, Average on power, Peak power, Average transmitted power, Pulse width, Rise time, Fall time, Repetition interval (seconds), Repetition interval (Hz), Duty factor (%), Duty factor (ratio), Ripple (dB), Ripple (%), Droop (dB), Droop (%), Overshoot (dB), Overshoot (%), Pulse- Ref Pulse frequency difference, Pulse- Ref Pulse phase difference, Pulse- Pulse frequency difference, Pulse- Pulse phase difference, RMS frequency error, Max frequency error, RMS phase error, Max phase error, Frequency deviation, Phase deviation, Impulse response (dB), Impulse response (time), Time stamp. |
| General Purpose Digital Modulation Analysis (Opt. 21) | Error Vector Magnitude (EVM) (RMS, Peak, EVM vs time), Modulation error ratio (MER), Magnitude error (RMS, Peak, Mag error vs time), Phase error (RMS, Peak, Phase error vs time), Origin offset, Frequency error, Gain imbalance, Quadrature error, Rho, Constellation, Symbol table |
| Flexible OFDM Analysis (Opt. 22) | OFDM analysis for WLAN 802.11a/j/g and WiMAX 802.16-2004 |
| WLAN 802.11a/b/g/j/p measurement application (Opt. 23) | All of the RF transmitter measurements as defined in the IEEE standard, as well as a wide range of additional measurements including Carrier Frequency error, Symbol Timing error, Average/peak burst power, IQ Origin Offset, RMS/Peak EVM, and analysis displays, such as EVM and Phase/Magnitude Error vs. time/frequency or vs. symbols/ subcarriers, as well as packet header decoded information and symbol table. Option 24 requires option 23. Option 25 requires option 24. |
| WLAN 802.11n measurement application (Opt. 24) | |
| WLAN 802.11ac measurement application (Opt. 25) | |
| APCO P25 compliance testing and analysis application (Opt. 26) | Complete set of push-button TIA-102 standard-based transmitter measurements with pass/fail results including ACPR, transmitter power and encoder attack times, transmitter throughput delay, frequency deviation, modulation fidelity, symbol rate accuracy, and transient frequency behavior, as well as HCPM transmitter logical channel peak ACPR, off slot power, power envelope and time alignment. |
| Bluetooth Basic LE TX SIG measurements (Opt. 27) | Presets for transmitter measurements defined by Bluetooth SIG for Basic Rate and Bluetooth Low Energy. Results also include Pass/Fail information. Application also provides packet header field decoding and can automatically detect the standard, including Enhanced Data Rate. |
| Bluetooth 5 measurements (Opt. 31) | Bluetooth SIG measurements for Bluetooth Low Energy version 5. Results also include Pass/Fail information. Application also provides Packet Header Field Decoding of LE Data Packets. Option 31 requires option 27. |
| LTE Downlink RF measurements (Opt. 28) | Presets for Cell ID, ACLR, SEM, Channel Power and TDD Toff Power. Supports TDD and FDD frame format and all base stations defined by 3GPP TS version 12.5. Results include Pass/Fail information. Real-Time settings make the ACLR and the SEM measurements fast, if the connected instrument has enough bandwidth. |
| 5G NR measurements (RSA5BUP Opt. 5GNR) | Presets for Channel Power (CHP), Adjacent Channel Power (ACP), Power Vs Time (PVT)2, Modulation Accuracy (including Error Vector Magnitude (EVM), Frequency Error, IQ Error), EVM vs. Symbol, Occupied Bandwidth (OBW), Spectral Emission Mask (SEM), Constellation Diagram, and summary table with scalar results. |
| Mapping and signal strength (Opt. MAP) | Both manual and automatic drive test are supported by built-in mapping software. Commercial off-the-shelf 3rd party GPS receiver supported via USB or Bluetooth® connection. Supports MapInfo format and scanned version maps. Also supports exporting to popular Google Earth and MapInfo map format for post analysis. Signal strength measurement provides both a visual indicator and audible tone of signal strength. |
| RSAVu Analysis Software | W-CDMA, HSUPA. HSDPA, GSM/EDGE, CDMA2000 1x, CDMA2000 1xEV-DO, RFID, Phase noise, Jitter, IEEE 802.11 a/b/g/n WLAN, IEEE 802.15.4 OQPSK (Zigbee), Audio analysis |
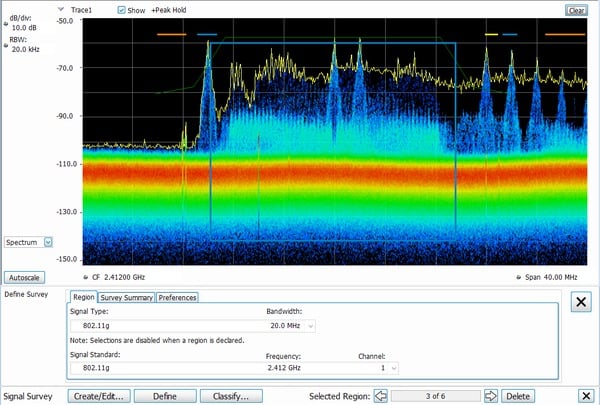
| Signal Classification | The signal classification application enables expert systems guidance to aid the user in classifying signals. It provides graphical tools that allow you to quickly create a spectral region of interest, enabling you to classify and sort signals efficiently. |
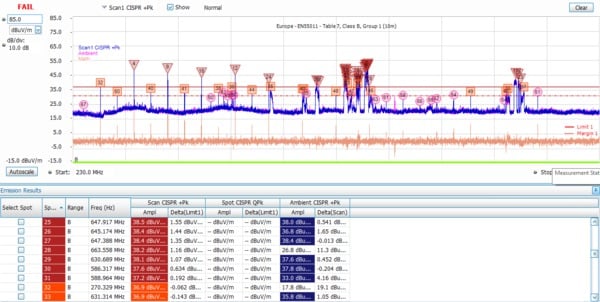
| EMC/EMI Pre-compliance and troubleshooting (Opt. 32) | This option supports many predefined limit lines. It also adds a wizard for easy setup of recommended antennas, LISN, and other EMC accessories with a one-button push. When using the new EMC-EMI display, you can accelerate the test by applying the time consuming quasi peak only on failures. This display also provides a push-button ambient measurement. The Inspect tool lets you measure frequencies of interest locally, removing the need for scanning. |


Specifications
All specifications are guaranteed unless noted otherwise. All specifications apply to all models unless noted otherwise.
Model overview
| RSA5103B | RSA5106B | RSA5115B | RSA5126B | |
|---|---|---|---|---|
| Frequency range | 1 Hz - 3 GHz | 1 Hz - 6.2 GHz | 1 Hz - 15 GHz | 1 Hz - 26.5 GHz |
| Real-time acquisition bandwidth | 25 MHz, 40 MHz, 85 MHz, 125 MHz, 165 MHz | |||
| Minimum Event Duration for 100% POI at 100% amplitude | 2.7 μs at 165 MHz BW (0.434 us, Opt. 300) 2.8 μs at 85 MHz BW (0.551 us, Opt. 300) 3.0 μs at 40 MHz BW (0.79 us, Opt. 300) 3.2 μs at 25 MHz BW (0.915 us, Opt. 300) | |||
| SFDR (typical) | >75 dBc (25/40 MHz)
>73 dBc (85/165 MHz) ≥ 80 dBc (Opts. B85HD, B125HD, B16xHD) | |||
| Trigger modes | Free run, Triggered, FastFrame | |||
| Trigger types | Power, Frequency mask, Frequency edge, DPX density, Runt, Time qualified | |||
Frequency related
- Reference frequency
Specification Standard Option PFR Conditions Initial accuracy at cal ± 1 x 10 -6 ± 1 x 10 -7 After 10 minute warm-up Aging per day 1 x 10 -8 1 x 10 -9 After 30 days of operation First year aging (typical) 1 x 10 -6 7.5 x 10 -8 After 1 year of operation Aging per 10 years 3 x 10 - 7 After 10 years of operation Temperature drift 2 x 10 -6 1 x 10 -7 From 5 to 40 °C Cumulative error (temperature + aging, typical) 3 x 10 -6 4 x 10 -7 Within 10 years after calibration
- Reference output level
- >0 dBm (internal or external reference selected), +4 dBm, typical
- External reference input frequency
- Every 1 MHz from 1 to 100 MHz plus 1.2288 MHz, 4.8 MHz, and 19.6608 MHz.
- External input must be within ± 1 x 10 -6 (Std), ± 3 x 10 -7 (Opt PFR) to stated input
- External reference input frequency requirements
- Spurious level on input must be < –80 dBc within 100 kHz offset to avoid on-screen spurs
- Spurious
- < –80 dBc within 100 kHz offset
- Input level range
- –10 dBm to +6 dBm
- Center frequency setting resolution
- 0.1 Hz
- Frequency marker readout accuracy
- ±(RE × MF + 0.001 × Span + 2) Hz
- (RE = Reference frequency error)
- (MF = Marker frequency (Hz))
- Span accuracy
- ±0.3% of span (Auto mode)
Trigger related
- Trigger event source
- RF input, Trigger 1 (front panel), Trigger 2 (rear panel), Gated, Line
- Trigger setting
- Trigger position settable from 1 to 99% of total acquisition length
- Trigger combinatorial logic
- Trigger 1 AND trigger 2 / gate may be defined as a trigger event
- Trigger actions
- Save acquisition and/or save picture on trigger
Power level trigger
- Level range
- 0 dB to –100 dB from reference level
- Accuracy
- For trigger levels >30 dB above noise floor, 10% to 90% of signal level
- Level ≥ –50 dB from reference level
- ±0.5 dB
- From < –50 dB to –70 dB from reference level
- ±1.5 dB
- Trigger bandwidth range
- At maximum acquisition bandwidth
- Standard (Opt. B25)
- 4 kHz to 10 MHz + wide open
- Opt. B40
- 4 kHz to 20 MHz + wide open
- Opt. B85/B16x
- 11 kHz to 40 MHz + wide open
- Trigger position timing uncertainty
- 25/40 MHz acquisition BW, 20 MHz trigger BW
- Uncertainty = ±15 ns
- 25/40 MHz acquisition BW, Max Trigger BW
- Uncertainty = ±12 ns
- 85/125/165 MHz acquisition BW, 60 MHz Trigger BW
- Uncertainty = ±5 ns
- 85/125/165 MHz acquisition BW, Max Trigger BW
- Uncertainty = ±4 ns
- Trigger re-arm time, minimum (fast frame on)
- 10 MHz acquisition BW
- ≤25 μs
- 40 MHz acquisition BW
- ≤10 μs
- 85/125 MHz acquisition BW
- ≤5 μs
- 165 MHz acquisition BW
- ≤5 μs
- Minimum event duration
- 25 MHz acquisition BW
- 25 ns
- 40 MHz acquisition BW
- 25 ns
- 85/125 MHz acquisition BW
- 6.2 ns
- 165 MHz acquisition BW
- 6.2 ns
External trigger 1
- Level range
- -2.5 V to +2.5 V
- Level setting resolution
- 0.01 V
- Trigger position timing uncertainty
- 50 Ω input impedance
- >20 MHz to 40 MHz acquisition BW
- ±20 ns
- >40 MHz to 80 MHz acquisition BW
- ±13.5 ns
- >80 MHz to 165 MHz acquisition BW
- ±11 ns
- Input impedance
- Selectable 50 Ω/5 kΩ impedance (nominal)
External trigger 2
- Threshold voltage
- Fixed, TTL
- Input impedance
- 10 kΩ (nominal)
- Trigger state select
- High, Low
Trigger output
- Voltage
- Output current <1 mA
- High
- >2.0 V
- Low
- <0.4 V
Frequency mask trigger
- Mask shape
- User defined
- Mask point horizontal resolution
- <0.12% of span
- Level range
- 0 dB to –80 dB from reference level
- Level accuracy3
- 0 to –50 dB from reference level
- ±(Channel response + 1.0 dB)
- –50 dB to –70 dB from reference level
- ±(Channel response + 2.5 dB)
- Span range
- 100 Hz to 25 MHz (Opt. B25)
- 100 Hz to 40 MHz (Opt. B40)
- 100 Hz to 85 MHz (Opt. B85, B85HD)
- 100 Hz to 125 MHz (Opt. B125, B125HD)
- 100 Hz to 165 MHz (Opt. B16x, B16xHD)
- Trigger position uncertainty
- Span = 25 MHz (Opt. B25)
±13 μs (RBW ≥ 300 kHz)
±7 μs (Opt. 09)
- Span = 40 MHz (Opt. B40)
±13 μs (RBW ≥ 300 kHz)
±6 μs (Opt. 09)
- Span = 85 MHz (Opt. B85)
±10 μs (RBW ≥ 1 MHz)
±3 μs (Opt. 09)
- Span = 165 MHz (Opt. B16x)
±9 μs (RBW ≥ 1 MHz)
±3 μs (Opt. 09)
- Minimum signal duration for 100% probability of trigger at 100% amplitude
Frequency-Mask and DPX signal processing (Option 300 with Option 09) Minimum signal duration, 100% probability of intercept, Frequency-Mask and DPX density trigger (μs)4 Span (MHz) RBW (kHz) FFT Length (points) Spectrums / sec Option 300 + Option 09 Standard Option 300 + Option 09 Full amplitude -3 dB 165 MHz 20000 1024 390,625 3,125,000 0.434 0.334 10000 1024 390,625 3,125,000 0.557 0.349 1000 1024 390,625 3,125,000 2.7 0.662 300 2048 195,313 195,313 13.1 6.1 100 8192 48,828 48,828 44.5 23.4 30 32768 12,207 12,207 161.9 91.7 25 32768 12,207 12,207 178.0 93.6 125 MHz 10000 1024 390,625 3,125,000 0.551 0.348 1000 1024 390,625 3,125,000 2.7 0.662 500 1024 390,625 3,125,000 5.1 1.2 300 2048 195,313 195,313 13.1 6.1 100 4096 97,656 97,656 44.5 13.2 30 16384 24,414 24,414 120.9 50.7 20 32768 24,414 24,414 201.9 96.5 85 MHz 10000 1024 390,625 3,125,000 0.55 0.348 1000 1024 390,625 3,125,000 2.7 0.662 500 1024 390,625 3,125,000 5.1 1.2 300 1024 390,625 3,125,000 8.3 1.9 100 4096 97,656 97,656 34.2 13.2 30 16384 24,414 24,414 121.0 50.7 20 16384 24,414 24,414 161.0 55.6 40 MHz 5000 1024 390,625 3,125,000 0.79 0.377 1000 1024 390,625 3,125,000 2.7 0.663 300 1024 390,625 3,125,000 8.3 1.9 100 2048 195,313 195,313 29.1 8.1 30 4096 97,656 97,656 90.4 21.8 20 8192 48,828 48,828 140.7 36.3 10 16384 24,414 24,414 281.3 72.6 25 MHz 3800 1024 390,625 3,125,000 0.915 0.392 1000 1024 390,625 3,125,000 2.7 0.664 300 1024 390,625 3,125,000 8.3 1.9 200 1024 390,625 3,125,000 12.3 2.8 Frequency-Mask and DPX signal processing Minimum signal duration, 100% probability of intercept, Frequency-Mask and DPX density trigger (μs)4 Span (MHz) RBW (kHz) FFT Length (points) Spectrums / sec Standard Opt. 09 Full amplitude -3 dB Full amplitude -3 dB 165 MHz 20000 1024 390,625 15.5 15.4 2.7 2.6 10000 1024 390,625 15.6 15.4 2.8 2.6 1000 1024 390,625 17.8 15.7 5.0 2.9 300 2048 195,313 23.4 16.3 13.1 6.1 100 8192 48,828 44.5 23.4 44.5 23.4 30 32768 12,207 161.9 91.7 161.9 91.7 25 32768 12,207 178.0 93.6 178.0 93.6 125 MHz 10000 1024 390,625 15.6 15.4 2.8 2.6 1000 1024 390,625 17.8 15.7 5.0 2.9 500 1024 390,625 20.2 15.9 7.4 3.1 300 2048 195,313 23.4 16.3 13.1 6.1 100 4096 97,656 44.5 23.4 34.2 13.2 30 16384 24,414 120.9 50.7 120.9 50.7 20 32768 24,414 201.9 96.5 201.9 96.5 85 MHz 10000 1024 390,625 15.6 15.4 2.8 2.6 1000 1024 390,625 17.8 15.7 5.0 2.9 500 1024 390,625 20.2 15.9 7.4 3.1 300 1024 390,625 23.4 16.3 10.6 3.5 100 4096 97,656 44.5 23.4 34.2 13.2 30 16384 24,414 121.0 50.7 121.0 50.7 20 16384 24,414 161.0 55.6 161.0 55.6 40 MHz 5000 1024 390,625 15.8 15.4 3.0 2.6 1000 1024 390,625 17.8 15.7 5.0 2.9 300 1024 390,625 23.3 16.3 10.5 3.5 100 2048 195,313 39.4 18.3 29.1 8.1 30 4096 97,656 90.4 21.8 90.4 21.8 20 8192 48,828 140.7 36.3 140.7 36.3 10 16384 24,414 281.3 72.6 281.3 72.6 25 MHz 3800 1024 390,625 16.0 15.4 3.2 2.6 1000 1024 390,625 17.7 15.7 4.9 2.9 300 1024 390,625 23.4 16.3 10.6 3.5 200 1024 390,625 27.4 16.8 14.6 4.1
Advanced triggers
- DPX density trigger
- Density range
- 0 to 100% density
- Horizontal range
0.25 Hz to 25 MHz (Opt. B25)
0.25 Hz to 40 MHz (Opt. B40)
0.25 Hz to 85 MHz (Opt. B85, B85HD)
0.25 Hz to 125 MHz (Opt. B125, B125HD)
0.25 Hz to 165 MHz (Opt. B16x, B16xHD)
- Minimum signal duration for 100% probability of trigger
- See minimum signal duration for 100% probability of trigger at 100% amplitude table
- Frequency edge trigger
- Range
- ±(½ × (ACQ BW or TDBW if TDBW is active))
- Minimum event duration
- 6.2 ns (ACQ BW = 165 MHz, no TDBW, Opt. 16x)
- 6.2 ns (ACQ BW = 85 MHz, no TDBW, Opt. B85)
- 25 ns (ACQ BW = 40 MHz, no TDBW, Opt. B40)
- 25 ns (ACQ BW = 25 MHz, no TDBW, Opt. B25)
- Timing uncertainty
- Same as power trigger position timing uncertainty
- Runt trigger
- Runt definitions
- Positive, Negative
- Accuracy (for trigger levels >30 dB above noise floor, 10% to 90% of signal level)
- ±0.5 dB (level ≥ -50 dB from reference level)
- ±1.5 dB (from < -50 dB to -70 dB from reference level)
- Time qualified triggering
- Trigger types and source
- Time qualification may be applied to: Level, Frequency mask, DPX Density, Runt, Frequency edge, Ext. 1, Ext. 2
- Time qualification range
- T1: 0 to 10 seconds
- T2: 0 to 10 seconds
- Time qualification definitions
- Shorter than T1
- Longer than T1
- Longer than T1 AND shorter than T2
- Shorter than T1 OR longer than T2
- Holdoff trigger
- Range
- 0 to 10 seconds
Acquisition related
- A/D converter
- 200 MS/s, 16 bit (Option B25, B40, B85, B16x); 400 MS/s, 14 bit (Option B85, B16x); 200 MS/s and 400 MS/s, 16 bit (Opt B85HD, B125HD, B16xHD)
- Acquisition memory size
- 1 GB (4 GB, opt. 53)
- Minimum acquisition length
- 64 samples
- Acquisition length setting resolution
- 1 sample
- Fast frame acquisition mode5
- Up to 1 Million records can be stored in a single acquisition (for pulse measurements and spectrogram analysis (with option 53))
- Memory depth (time) and minimum time domain resolution
Acq. BW (max span) Sample rate (for I and Q)
Record length (Std.) Record length (Opt. 53)
Time resolution 165 MHz 200 MS/s 1.34 s 5.37 s 5 ns 85 MHz 200 MS/s 1.34 s 5.37 s 5 ns 80 MHz 100 MS/s 2.68 s 10.74 s 10 ns 40 MHz 50 MS/s 4.77 s 19.09 s 20 ns 25 MHz 50 MS/s 4.77 s 19.09 s 20 ns 20 MHz 25 MS/s 4.77 s 38.18 s 20 ns 10 MHz 12.5 MS/s 19.09 s 76.35 s 80 ns 5 MHz 6.25 MS/s 38.18 s 152.71 s 160 ns 2 MHz 6 3.125 MS/s 42.9 s 171.8 s 320 ns 1 MHz 1.563 MS/s 85.9 s 343.6 s 640 ns 500 kHz 781.25 kS/s 171.8 s 687.2 s 1.28 μs 200 kHz 390.625 kS/s 343.6 s 1374.4 s 2.56 μs 100 kHz 195.313 kS/s 687.2 s 2748.8 s 5.12 μs 50 kHz 97.656 kS/s 1374.4 s 5497.6 s 10.24 μs 20 kHz 48.828 kS/s 2748.8 s 10955.1 s 20.48 μs 10 kHz 24.414 kS/s 5497.6 s 21990.2 s 40.96 μs 5 kHz 12.207 kS/s 10955.1 s 43980.5 s 81.92 μs 2 kHz 3.052 kS/s 43980.4 s 175921.8 s 328 μs 1 kHz 1.526 kS/s 87960.8 s 351843.6 s 655 μs 500 Hz 762.9 S/s 175921.7 s 703687.3 s 1.31 ms 200 Hz 381.5 S/s 351843.4 s 1407374.5 s 2.62 ms 100 Hz 190.7 S/s 703686.8 s 2814749.1 s 5.24 ms
Displays and measurements
- Frequency views
Spectrum (amplitude vs linear or log frequency)
DPX® spectrum display (live RF color-graded spectrum)
Spectrogram (amplitude vs frequency over time)
Spurious (amplitude vs linear or log frequency)
Phase noise (phase noise and Jitter measurement) (Opt. 11)
- Time and statistics views
Amplitude vs time
Frequency vs time
Phase vs time
DPX amplitude vs time
DPX frequency vs time
DPX phase vs time
Amplitude modulation vs time
Frequency modulation vs time
RF IQ vs time
Time overview
CCDF
Peak-to-Average ratio
- Settling time, frequency, and phase (Opt. 12) views
- Frequency settling vs time, Phase settling vs time
- Noise figure and gain (Opt. 14) views
Noise figure vs. frequency
Gain vs. frequency
Noise figure, gain at a single frequency
Y-factor vs. frequency
Noise temperature vs. frequency
Uncertainty calculator
Results table of all measurements
- Advanced Pulse Analysis
Pulse results table
Pulse trace (selectable by pulse number)
Pulse statistics (trend of pulse results, FFT of time trend and histogram)
Cumulative Statistics, Cumulative Histogram and Pulse-Ogram
- Digital demod (Opt. 21) views
Constellation diagram
EVM vs time
Symbol table (binary or hexadecimal)
Magnitude and phase error versus time, and signal quality
Demodulated IQ vs time
Eye diagram
Trellis diagram
Frequency deviation vs time
- Flexible OFDM analysis (Opt. 22) views
Constellation, scalar measurement summary
EVM or power vs carrier
Symbol table (binary or hexadecimal)
- Frequency offset analysis
- Signal analysis can be performed either at center frequency or the assigned measurement frequency up to the limits of the instrument's acquisition and measurement bandwidths.
- WLAN 802.11a/b/g/j/p measurement application (Opt. 23)
WLAN Power vs time, WLAN symbol table, WLAN constellation, Spectrum emission mask
Error vector magnitude (EVM) vs symbol (or time), vs subcarrier (or frequency)
Mag error vs symbol (or time), vs subcarrier (or frequency)
Phase error vs symbol (or time), vs subcarrier (or frequency)
Channel frequency response vs symbol (or time), vs subcarrier (or frequency)
Spectral flatness vs symbol (or time), vs subcarrier (or frequency)
- WLAN 802.11n measurement application (Opt. 24)
WLAN Power vs time, WLAN symbol table, WLAN constellation, Spectrum emission mask
Error vector magnitude (EVM) vs symbol (or time), vs subcarrier (or frequency)
Mag error vs symbol (or time), vs subcarrier (or frequency)
Phase error vs symbol (or time), vs subcarrier (or frequency)
Channel frequency response vs symbol (or time), vs subcarrier (or frequency)
Spectral flatness vs symbol (or time), vs subcarrier (or frequency)
- WLAN 802.11ac measurement application (Opt. 25)
WLAN Power vs time, WLAN symbol table, WLAN constellation, Spectrum emission mask
Error vector magnitude (EVM) vs symbol (or time), vs subcarrier (or frequency)
Mag error vs symbol (or time), vs subcarrier (or frequency)
Phase error vs symbol (or time), vs subcarrier (or frequency)
Channel frequency response vs symbol (or time), vs subcarrier (or frequency)
Spectral flatness vs symbol (or time), vs subcarrier (or frequency)
- APCO P25 measurement application (Opt. 26)
RF output power, operating frequency accuracy, modulation emission spectrum,
unwanted emissions spurious, adjacent channel power ratio, frequency deviation,
modulation fidelity, frequency error, eye diagram, symbol table, symbol rate accuracy,
transmitter power and encoder attack time, transmitter throughput delay, frequency deviation vs. time,
power vs. time, transient frequency behavior, HCPM transmitter logical channel peak adjacent channel power ratio,
HCPM transmitter logical channel off slot power, HCPM transmitter logical channel power envelope,
HCPM transmitter logical channel time alignment, cross-correlated markers
- Bluetooth Measurements (Opt. 27 and Opt. 31)
Peak power, average power, adjacent channel power or inband emission mask,
-20dB bandwidth, frequency error, modulation characteristics including ΔF1avg (11110000),
ΔF2avg (10101010), ΔF2 > 115 kHz, ΔF2/ΔF1 ratio, frequency deviation vs. time with packet
and octet level measurement information, carrier frequency f0, frequency offset (Preamble
and Payload), max frequency offset, frequency drift f1-f0, max drift rate fn-f0
and fn-fn-5, center frequency offset table and frequency drift table, color-coded
symbol table, packet header decoding information, eye diagram, constellation diagram,
editable limits.
- LTE Downlink RF measurements (Opt. 28)
- Adjacent Channel Leakage Ratio (ACLR), Spectrum Emission Mask (SEM), Channel Power, Occupied Bandwidth, Power vs Time is for uplink only displaying Transmitter OFF power for TDD signals and LTE constellation diagram for PSS, SSS with Cell ID, Group ID, Sector ID and Frequency Error.
- 5G NR Uplink/Downlink measurements (RSA5BUP Opt. 5GNR)
- Channel Power (CHP), Adjacent Channel Power (ACP), Power vs Time (PVT)2, Modulation Accuracy (including Error Vector Magnitude (EVM), Frequency Error, IQ Error), EVM vs. Symbol, Occupied Bandwidth (OBW), Spectral Emission Mask (SEM), Constellation Diagram, and summary table with scalar results.
- EMC pre-compliance and troubleshooting Opt. 32
- EMC-EMI display, Pre-compliance Setup Wizard, Measure Ambient, Re-measure Spot, Report. Troubleshooting tools: Inspect, Harmonic Markers, Level Target, Compare Traces, Persistence display
Bandwidth related
- Resolution bandwidth
- Resolution bandwidth range (spectrum analysis)
- 0.1 Hz to 5 MHz (10 MHz with Opt. B85, 20 MHz with Opt. B16x) (1, 2, 3, 5 sequence, Auto-coupled), or user selected (arbitrary)
- Resolution bandwidth shape
- Approximately Gaussian, shape factor 4.1:1 (60:3 dB) ±3%, typical
- Resolution bandwidth accuracy
- ±0.5% (Auto-coupled RBW mode)
- Alternative resolution bandwidth types
- Kaiser window (RBW, Gaussian), –6 dB mil, CISPR, Blackman-Harris 4B window, Uniform (none) window, Flat-top (CW ampl.) window, Hanning window
- Video bandwidth
- Video bandwidth range
- 1 Hz to 10 MHz plus wide open
- RBW/VBW maximum
- 10,000:1
- RBW/VBW minimum
- 1:1 plus wide open
- Resolution
- 5% of entered value
- Accuracy (typical)
- ±10%
- Time domain bandwidth (amplitude vs time display)
- Time domain bandwidth range
- At least 1/10 to 1/10,000 of acquisition bandwidth, 1 Hz minimum
- Time domain BW shape
- 20 MHz (60 MHz, Opt. B85/B16x), shape factor <2.5:1 (60:3 dB) typical
- Time domain bandwidth accuracy
- ≤10 MHz, approximately Gaussian, shape factor 4.1:1 (60:3 dB), ±10% typical
1 Hz to 20 MHz, and (>20 MHz to 60 MHz Opt. B85/B16x), ±10%
- Minimum settable spectrum analysis RBW vs. span
Frequency span RBW >10 MHz 100 Hz >1.25 MHz to 10 MHz 10 Hz ≤1 MHz 1 Hz ≤100 kHz 0.1 Hz
Spectrum display
- Traces
- Three traces + 1 math waveform + 1 trace from spectrogram for spectrum display
- Detector
- Peak, –Peak, Average (VRMS), ±Peak, Sample, CISPR (Avg, Peak, Quasi-peak average (of logs))
- Trace functions
- Normal, Average, Max hold, Min hold, Average (of logs)
- Spectrum trace length
- 801, 2401, 4001, 8001, 10401, 16001, 32001, 64001 points
- Sweep speed (typical-mean)
- RBW = auto, RF/IF optimization: minimize sweep time
- Opt. B25
- 2000 MHz/s
- Opt. B40
- 3300 MHz/s
- Opt. B85
- 8000 MHz/s (RSA5103B/RSA5106B)
- 6000 MHz/s (RSA5115B/RSA5126B)
- Opt. B16x
- 11000 MHz/s (RSA5103B/RSA5106B)
- 8000 MHz/s (RSA5115B/RSA5126B)
- Minimum FFT Length vs. Trace Length (Independent of Span and RBW)
Trace length (points) Minimum FFT length 801 4001 1024 8192 2401 10401 4096 16384
DPX related
- DPX® digital phosphor spectrum processing
Characteristic Performance Spectrum processing rate (RBW = auto, trace length 801) 390,625 per second Spectrum processing rate (RBW = auto, trace length 801) (Option 300 with Option 09) 3,125,000 per second for Span/RBW ratio ≤ 333
390,625 per second for Span/RBW ratio > 333 DPX bitmap resolution 201 × 801 DPX bitmap color dynamic range 233 levels Marker information Amplitude, frequency, and signal density on the DPX display Minimum signal duration for 100% probability of detection (Max-hold on) See minimum signal duration for 100% probability of trigger at 100% amplitude table Span Range (Continuous processing)
100 Hz to 25 MHz (Opt. B25)
(40 MHz with Opt. B40)
(85 MHz with Opt. B85, B85HD)
(125 MHz with Opt. B125, B125HD)
(165 MHz with Opt. B16x, B16xHD)
Span range (Swept) Up to instrument frequency range Dwell time per step 50 ms to 100 s Trace processing Color-graded bitmap, +Peak, –Peak, average Trace length 801, 2401, 4001, 10401 Resolution BW accuracy (Auto-Coupled) ±0.5%
- Resolution BW Range vs. Acquisition Bandwidth (DPX®)
Acquisition bandwidth RBW (Min) RBW (Max) 165 MHz 25 kHz 20 MHz 85 MHz 12.9 kHz 10 MHz 40 MHz 6.06 kHz 10 MHz 25 MHz 3.79 kHz 3.8 MHz 20 MHz 3.04 kHz 3.04 MHz 10 MHz 1.52 kHz 1.52 MHz 5 MHz 758 Hz 760 kHz 2 MHz 303 Hz 304 kHz 1 MHz 152 Hz 152 kHz 500 kHz 75.8 Hz 76 kHz 200 kHz 30.3 Hz 30.4 kHz 100 kHz 15.2 Hz 15.2 kHz 50 kHz 7.58 Hz 7.6 kHz 20 kHz 3.03 Hz 3.04 kHz 10 kHz 1.52 Hz 1.52 kHz 5 kHz 758 Hz 760 Hz 2 kHz 0.303 Hz 304 Hz 1 kHz 0.152 Hz 152 Hz 500 Hz 0.1 Hz 76 Hz 200 Hz 0.1 Hz 30.4 Hz 100 Hz 0.1 Hz 15.2 Hz
Stability
- Residual FM
- <2 Hzp-p in 1 second (95% confidence, typical).
Phase related
- Phase noise sidebands
dBc/Hz at specified center frequency (CF)
CF = 10 MHz CF = 1 GHz CF = 2 GHz CF = 6 GHz CF = 10 GHz CF = 20 GHz Offset Typical Spec/Typical Typical Typical Typical Typical 1 kHz –128 –103/–107 –107 –104 –99 –95 10 kHz –134 –109/–113 –112 –108 –108 –106 100 kHz –134 –112/–117 –115 –114 –108 –106 1 MHz –135 –130/–139 –137 –135 –128 –125 6 MHz –140 –137/–146 –142 –147 –145 –140 10 MHz NA –137/–146 –142 –147 –147 –144
- Integrated phase (RMS), typical
- Integrated from 1 kHz to 10 MHz.
Measurement frequency Integrated phase, radians 1 GHz 1.01 × 10⁻³ 2 GHz 1.23 × 10⁻³ 6 GHz 1.51 × 10⁻³ 10 GHz 2.51 × 10⁻³ 20 GHz 3.27 × 10⁻³ Typical phase noise performance as measured by Opt. 11.

Amplitude
Specifications excluding mismatch error
- Measurement range
- Displayed average noise level to maximum measurable input
- Input attenuator range
- 0 dB to 55 dB, 5 dB step
- Maximum safe input level
- Average continuous
- +30 dBm (RF ATT ≥10 dB, preamp off)
- Average continuous
- +20 dBm (RF ATT ≥10 dB, preamp on)
- Pulsed RF
- 50 W (RF ATT ≥30 dB, PW <10 μs, 1% duty cycle)
- Maximum measurable input level
- Average continuous
- +30 dBm (RF ATT: Auto)
- Pulsed RF
- 10 W (RF Input, RF ATT: Auto, PW <10 μs, 1% duty cycle repetitive pulses)
- Max DC voltage
- ±5 V
- Log display range
- 0.01 dBm/div to 20 dB/div
- Display divisions
- 10 divisions
- Display units
- dBm, dBmV, Watts, Volts, Amps, dBuW, dBuV, dBuA, dBW, dBV, dBV/m, and dBA/m
- Marker readout resolution, dB units
- 0.01 dB
- Marker readout resolution, Volts units
- Reference-level dependent, as small as 0.001 μV
- Reference level setting range
- 0.1 dB step, –170 dBm to +50 dBm (minimum ref. level –50 dBm at center frequency <80 MHz)
- Level linearity
- ±0.1 dB (0 to –70 dB from reference level)
Amplitude accuracy
- Absolute amplitude accuracy at calibration point
- ±0.31 dB (100 MHz, –10 dBm signal, 10 dB ATT, 18 °C to 28 °C)
- Input attenuator switching uncertainty
- ±0.3 dB (RSA5103B/RSA5106B)
- ±0.15 dB (RSA5115B/RSA5126B)
- Absolute amplitude accuracy at center frequency, 95% confidence7
- 10 MHz to 3 GHz
- ±0.3 dB
- 3 GHz to 6.2 GHz (RSA5106B/15B/26B)
- ±0.5 dB
- 6.2 GHz to 15 GHz (RSA5115B/26B)
- ±0.75 dB
- 15 GHz to 26.5 GHz (RSA5126B)
- ±0.9 dB
- VSWR
Typical RSA5103B / RSA5106B 8 Frequency range Preamp OFF (95% confidence) Preamp ON (Typical) Preamp ON, 0 dB attenuation (Typical) >10 kHz to 10 MHz <1.6 -- -- >10 MHz to 2.0 GHz <1.1 <1.2 <1.5 >2 GHz to 3 GHz <1.25 <1.4 <1.6 >3 GHz to 5 GHz <1.25 <1.4 <1.4 >5 GHz to 5.5 GHz <1.3 <1.4 <1.4 >5.5 GHz to 6.2 GHz <1.3 <1.4 <1.75 Typical RSA5115B / RSA5126B8 Frequency range Preamp OFF (95% confidence) Preamp ON (Typical) Preamp ON, 0 dB attenuation (Typical) >10 kHz to 10 MHz <1.6 -- -- 10 MHz to 3.0 GHz <1.3 <1.4 <1.9 >3.0 GHz to 6.2 GHz <1.3 <1.5 <1.9 >6.2 GHz to 11 GHz <1.5 <1.8 <1.9 (RSA5115B) <2.25 (RSA5126B)
>11 GHz to 15 GHz <1.5 <1.8 <1.9 >15 GHz to 22 GHz <1.5 <1.8 <1.9 >22 GHz to 25 GHz <1.7 <2.0 <1.9 >25 GHz to 26.5 GHz <1.7 <2.0 <2.1
Frequency response
- 18 °C to 28 °C, atten. = 10 dB, preamp off
- 10 MHz to 32 MHz (LF band)
- ±0.2 dB
- 10 MHz to 3 GHz
- ±0.35 dB
- >3 GHz to 6.2 GHz (RSA5106B)
- ±0.5 dB
- >6.2 GHz to 15 GHz (RSA5115B)
- ±1.0 dB
- >15 GHz to 26.5 GHz (RSA5115B)
- ±1.2 dB
- 5 °C to 40 °C, all attenuator settings (typical, preamp off)
- 100 Hz to 32 MHz (LF band)
- ±0.8 dB
- 9 kHz to 3 GHz
- ±0.5 dB
- 1 MHz to 3 GHz (RSA5115B/26B)
- ±0.5 dB
- >3 GHz to 6.2 GHz (RSA5106B)
- ±1.0 dB
- >6.2 GHz to 15 GHz (RSA5115B/26B)
- ±1.0 dB
- >15 GHz to 26.5 GHz (RSA5126B)
- ±1.5 dB
- 5 °C to 40 °C, (RSA5103B/RSA5106B Opt. 50) (typical, preamp on, atten.=10 dB)
- 1 MHz to 32 MHz (LF band)
- ±0.8 dB
- 1 MHz to 3 GHz
- ±0.8 dB
- >3 GHz to 6.2 GHz (RSA5106B)
- ±1.3 dB
- 5 °C to 40 °C, (RSA5115B / RSA5126B Opt. 51) (typical, preamp on, atten.=10 dB)
- 1 MHz to 3 GHz
- ±0.8 dB
- >3 GHz to 6.2 GHz
- ±1.3 dB
- >6.2 GHz to 15 GHz
- ±1.5 dB
- >15 GHz to 26.5 GHz (RSA5126B)
- ±2.0 dB
Noise and distortion
- 3rd order intermodulation distortion at 2.13 GHz 9
- RSA5103B / RSA5106B
- –84 dBc
- RSA5115B / RSA5126B
- –80 dBc
- 3rd order intermodulation distortion – typical9
- Note: 3rd order intercept point is calculated from 3rd order intermodulation performance.
Frequency range 3rd order intermodulation distortion, dBc (typical) 3rd order intercept, dBm (typical) RSA5103B/5106B RSA5115B/5126B RSA5103B/5106B RSA5115B/5126B 10 kHz to 32 MHz (LF band)
–75 –75 +12.5 +12.5 1 MHz to 120 MHz –70 –70 +10 +10 >80 MHz to 300 MHz –76 –76 +13 +13 >300 MHz to 6.2 GHz –84 –82 +17 +16 >6.2 GHz to 15 GHz -- –72 -- +11 15 GHz to 26.5 GHz -- –72 -- +11
- 3rd order intermodulation distortion (preamp ON) – typical9
- Note: 3rd order intercept point is calculated from 3rd order intermodulation performance.
Frequency range 3rd order intermodulation distortion, dBc (typical) 3rd order intercept, dBm (typical) RSA5103B/5106B RSA5115B/5126B RSA5103B/5106B RSA5115B/5126B 1 MHz to 32 MHz (LF band)
-75 -75 -12.5 -12.5 1 MHz to 120 MHz -70 -80 -15 -10 >120 MHz to 300 MHz -75 -80 -12.5 -10 >300 MHz to 3.0 GHz -80 -90 -10 -5 >3.0 GHz to 6.2 GHz -90 -90 -5 -5 >6.2 GHz to 15 GHz -- -80 -- -10 >15 GHz to 126.5 GHz -- -80 -- -10
- RSA5103B / RSA5106B 2nd harmonic distortion10
- 10 MHz to 1 GHz
- < –80 dBc
- >1 GHz to 3.1 GHz
- < –83 dBc
- RSA5115B / RSA5126B 2nd harmonic distortion10
- 10 MHz to 500 MHz
- < –80 dBc
- >500 MHz to 1 GHz
- < –74 dBc
- >1 GHz to 3.1 GHz
- < –74 dBc
- >3.1 GHz to 7.5 GHz
- < –85 dBc
- >7.5 GHz to 13.25 GHz
- < –85 dBc
- RSA5103B / RSA5106B displayed average noise level11, preamp off
Frequency range Spec, dBm/Hz Typical , dBm/Hz LF Band (all models) 1 Hz to 100 Hz -- –129 >100 Hz to 2 kHz –124 –143 >2 kHz to 10 kHz –141 –152 >10 kHz to 32 MHz –150 –153 RF band 9 kHz to 1 MHz –108 –111 >1 MHz to 10 MHz –136 –139 >10 MHz to 2 GHz –153 –157 >2 GHz to 3 GHz –152 –156 >3 GHz to 4 GHz (RSA5106B) –151 –155 >4 GHz to 6.2 GHz (RSA5106B) –149 –153
- RSA5115B / RSA5126B displayed average noise level, preamp off11
Frequency range Spec, dBm/Hz Typical , dBm/Hz LF Band (all models) 1 Hz to 100 Hz –129 >100 Hz to 2 kHz –124 –143 >2 kHz to 10 kHz –141 –152 >10 kHz to 32 MHz –150 –153 RF band >1 MHz to 10 MHz –136 –139 >10 MHz to 3 GHz –152 –155 >3 GHz to 4 GHz –151 –155 >4 GHz to 6.2 GHz –149 –152 >6.2 GHz to 13 GHz –146 –149 >13 GHz to 23 GHz –144 –147 >23 GHz to 26.5 GHz (RSA5126B) –140 –143
- Preamplifier performance (Opt. 50)
- Frequency range
- 1 MHz to 3.0 GHz or 6.2 GHz (RSA5106B)
- Noise figure at 2 GHz
- 7 dB
- Gain at 2 GHz
- 20 dB (nominal)
- Preamplifier performance (Opt. 51)
- Frequency range
- 1 MHz to 15 GHz or 26.5 GHz (RSA5115B or RSA5126B)
- Noise figure at 15 GHz
- <10 dB
- Noise figure at 26.5 GHz
- <13 dB
- Gain at 10 GHz
- 20 dB (nominal)
- Displayed Average Noise Level11, preamp on (Opt. 50)
Frequency range Specification Typical LF band 1 MHz to 32 MHz –158 dBm/Hz –160 dBm/Hz RF band 1 MHz to 10 MHz –158 dBm/Hz –160 dBm/Hz >10 MHz to 2 GHz –164 dBm/Hz –167 dBm/Hz >2 GHz to 3 GHz –163 dBm/Hz –165 dBm/Hz >3 GHz to 6.2 GHz (RSA5106B) –162 dBm/Hz –164 dBm/Hz
- Displayed average noise level11, preamp on (Opt. 51)
Frequency range Specification Typical RF band 1 MHz to 10 MHz –158 dBm/Hz –160 dBm/Hz >10 MHz to 2 GHz –164 dBm/Hz –167 dBm/Hz >2 GHz to 3 GHz –163 dBm/Hz –165 dBm/Hz >3 GHz to 4 GHz –160 dBm/Hz –163 dBm/Hz >4 GHz to 6.2 GHz –159 dBm/Hz –162 dBm/Hz >6.2 GHz to 13 GHz –159 dBm/Hz –162 dBm/Hz >13 GHz to 23 GHz –157 dBm/Hz –160 dBm/Hz >23 GHz to 26.5 GHz –153 dBm/Hz –156 dBm/Hz
- Residual response
- Input terminated, RBW = 1 kHz, attenuator = 0 dB, reference level –30 dBm
- 500 kHz to 32 MHz, LF band
- < –100 dBm (typical)
- 1 MHz to 80 MHz, RF band
- < –75 dBm (typical)
- >80 MHz to 200 MHz
- < –95 dBm (typical)
- >200 MHz to 3 GHz
- –95 dBm
- >3 GHz to 6.2 GHz (RSA5106B / RSA5115B / RSA5126B)
- –95 dBm
- >6.2 GHz to 15 GHz (RSA5115B / RSA5126B)
- –95 dBm
- >15 GHz to 26.5 GHz (RSA5126B)
- –95 dBm
- Image response, up to 165 MHz bandwidth
- Ref = –30 dBm, attenuator = 10 dB, RF input level = –30 dBm, RBW = 10 Hz.
- 100 Hz to 30 MHz
- < –75 dBc
- 30 MHz to 3 GHz
- < –75 dBc
- >3 GHz to 6.2 GHz (RSA5106B)
- < –70 dBc
- >6.2 GHz to 15 GHz (RSA5115B / RSA5126B)
- < –76 dBc
- >15 GHz to 26.5 GHz (RSA5126B)
- < –72 dBc
- Spurious response with signal at CF, offset ≥400 kHz12
Span ≤25 MHz (Opt. B25) Span ≤40 MHz (Opt. B40) 13 Opt. B85/B125/B16x13 Opt. B85HD, B125HD, B16xHD13 Swept spans >25 MHz Swept spans >40 MHz 40 MHz < span ≤ 160 MHz 40 MHz < span ≤160 MHz
Frequency Specification Typical Specification Typical Specification Typical Typical 10 kHz to 32 MHz (LF band) –80 dBc –85 dBc -- -- -- -- -- 30 MHz to 3 GHz –73 dBc –80 dBc –73 dBc –80 dBc –73 dBc –75 dBc –80 dBc >3 GHz to 6.2 GHz (RSA5106B / RSA5115B / RSA5126B) –73 dBc –80 dBc –73 dBc –80 dBc –73 dBc –75 dBc –80 dBc 6.2 GHz to 15 GHz (RSA5115B / RSA5126B) –70 dBc –80 dBc –70 dBc –80 dBc –70 dBc –73 dBc –80 dBc 15 GHz to 26.5 GHz (RSA5126B) –66 dBc –76 dBc –66 dBc –76 dBc –66 dBc –73 dBc –76 dBc
- Spurious response with signal at CF (10 kHz ≤ offset < 400 kHz, Span = 1 MHz)12
Frequency Typical 10 kHz to 32 MHz (LF band) –75 dBc 30 MHz to 3 GHz –75 dBc 3 GHz to 6.2 GHz (RSA5106B) –75 dBc 6.2 GHz to 15 GHz (RSA5115B / RSA5126B) –75 dBc 15 GHz to 26.5 GHz (RSA5126B) –68 dBc
- Spurious response with signal at Half-IF (3.532.75 GHz)
- <–80 dBc (RF input level, –30 dBm)
- Spurious response with signal, other than CF (typical)
Frequency Span ≤25MHz, swept spans >25MHz Opt. B40, Span ≤40MHz, swept spans >40 MHz 14 Opt. B85, 40MHz < Span ≤ 85 MHz14 Opt. B16x, 85MHz < Span ≤ 165 MHz14,15 Opt. B85HD, B125HD, B16xHD, 40 MHz < span ≤160 MHz14 1 MHz - 32 MHz (LF Band) –80 dBc -- -- -- -- 30 MHz - 3 GHz –80 dBc –80 dBc –76 dBc –73 dBc -80 dBc 3 GHz - 6.2 GHz (RSA5106B) –80 dBc –80 dBc –76 dBc –73 dBc -80 dBc 6.2 GHz - 15 GHz (RSA5115B) –80 dBc –80 dBc –73 dBc –73 dBc -80 dBc 15 GHz - 26.5 GHz (RSA5126B) –76 dBc –76 dBc –73 dBc –73 dBc -76 dBc
- Local oscillator feed-through to input connector (attenuator = 10 dB)
- < –60 dBm (RSA5103B / RSA5106B)
- < –90 dbm (RSA5115B / RSA5126B)
- Adjacent channel leakage ratio dynamic range
- Measured with test signal amplitude adjusted for optimum performance (CF = 2.13 GHz)
ACLR, typical Signal type, measurement mode Adjacent Alternate 3GPP downlink, 1 DPCH Uncorrected –69 dB –70 dB Noise corrected –75 dB –77 dB
- IF frequency response and phase linearity, includes all preselection and image rejection filters16
Measurement frequency (GHz) Acquisition bandwidth Amplitude flatness (Spec) Amplitude flatness (Typ, RMS)
Phase linearity (Typ, RMS)
0.001 to 0.032 (LF band) ≤20 MHz ±0.4 dB 0.3 dB 0.5° Opt. B25 0.01 to 6.2 17 ≤300 kHz ±0.1 dB 0.05 dB 0.1° 0.03 to 6.2 ≤25 MHz ±0.3 dB 0.2 dB 0.5° Opt. B40 0.03 to 6.2 ≤40 MHz ±0.3 dB 0.2 dB 0.5° Opt. B85/B85HD 0.07 to 3.0 ≤85 MHz ±0.5 dB 0.3 dB 1.5° >3.0 to 6.2 ≤85 MHz ±0.5 dB 0.4 dB 1.5° Opt. B125/B125HD 0.07 to 6.2 ≤125 MHz ±1.0 dB 0.70 dB 1.5° Opt. B16x/B16xHD 0.07 to 6.2 ≤165 MHz ±0.5 dB 0.4 dB 1.5°
- RSA5115B / RSA5126B IF frequency response and phase linearity
- Includes all preselection and image rejection filters 16
Measurement frequency (GHz) Span Amplitude flatness (Spec) Amplitude flatness (Typ, RMS)
Phase linearity (Typ, RMS)
6.2 to 26.5 ≤300 kHz ±0.10 dB17 0.05 dB 0.2° 6.2 to 26.5 ≤25/40 MHz ±0.50 dB 0.40 dB 1.0° 6.2 to 26.5 ≤80 MHz ±0.75 dB 0.70 dB 1.5° 6.2 to 26.5 ≤125 MHz ±1.0 dB 0.70 dB 1.5° 6.2 to 26.5 ≤165 MHz ±1.0 dB 0.70 dB 1.5°
DPX zero-span performance
- Zero-span amplitude, frequency, phase performance (nominal)
- Measurement BW range
- 100 Hz to maximum acquisition bandwidth of instrument
- Time domain BW (TDBW) range
- At least 1/10 to 1/10,000 of acquisition bandwidth, 1 Hz minimum
- Time domain BW (TDBW) accuracy
- ±1%
- Sweep time range
100 ns (minimum)
2000 s (maximum, Measurement BW >80 MHz)
- Time accuracy
- ±(0.5% + Reference frequency accuracy)
- Zero-span trigger timing uncertainty (Power trigger)
- ±(Zero-span sweep time/400) at trigger point
- DPX frequency display range
- ±100 MHz maximum
- DPX phase display range
- ±200 degrees maximum
- DPX waveforms/s
- 50,000 triggered waveforms/s for sweep time ≤20 μs
- DPX spectrogram trace detection
- +Peak, –Peak, Avg (VRMS)
- DPX spectrogram trace length
- 801 to 10401
- DPX spectrogram memory depth
- Trace length = 801: 60,000 traces
- Trace length = 2401: 20,000 traces
- Trace length = 4001: 12,000 traces
- Trace length = 10401: 4,600 traces
- Time resolution per line
- User settable 125 µs to 6400 s
- Maximum recording time vs line resolution
- 7.5 seconds (801 points/trace, 125 μs/line) to 4444 days (801 points/trace, 6400 s/line)
Digital IQ Output (Opt. 65)
- Connector type
- MDR (3M) 50 pin × 2
- Data output
- Data is corrected for amplitude and phase response in real time
- Data format
- I data: 16 bit LVDS
- Q data: 16 bit LVDS
- Control output
- Clock: LVDS, Max 50 MHz (200 MHz, Opt. B85, B16x) DV (Data valid), MSW (Most significant word) indicators, LVDS
- Control input
- IQ data output enabled, connecting GND enables output of IQ data
- Clock rising edge to data transition time (Hold time)
- 8.4 ns (typical, Opt. B25 or B40), 1.58 ns (typical, Opt. B85 or B16x)
- Data transition to clock rising edge (Setup time)
- 8.2 ns (typical, Opt. B25 or B40), 1.54 ns (typical, Opt. B85 or Opt. B16x)
Zero-span analog output (Opt. 66)
- General information
- Option 66 provides for a real-time analog representation of the detected output of the analyzer. This output is available when either the DPX spectrum or DPX zero span function is used in spans up to the maximum acquisition bandwidth. The bandwidth of the analog output is adjustable using the resolution bandwidth control of the DPX spectrum analyzer, or can be made independent of the spectrum analyzer. The output is "OFF" when the instrument is in swept spectrum analyzer mode, as it does not correspond to the output of the swept output
- Connector type
- BNC - Female
- Output impedance
- On: 50 Ω, Off: 5 kΩ
- Output voltage
- Typical
- 1.0V @ 0 dBm input
- 0 dBm reference level, 10 dB/div vertical scale, measured into a 50 Ω load. Full-scale voltage is relative to reference level.
- Maximum
- 1.25 V
- Accuracy
- ± 5% of full-scale voltage
- Slope
- 10 mV/dB
- 10 dB/div vertical scale, measured into a 50 Ω load. Slope will vary with vertical scale setting.
- Output range log fidelity
- > 60 dB @ 1 GHz CF
- Output log accuracy
- ± 0.75 dB within range
- Output delay accuracy
- RF Input to Analog Out
- ± (1 μs + 10%)
- Output bandwidth
- Up to maximum RBW
- Continuous output
- Continuous output for spans up to the maximum real-time acquisition bandwidth of the instrument.
- Output is disabled for swept spans.
- Output reverse power protection
- ±20 V
AM/FM/PM and direct audio measurement (Opt. 10)
- Analog demodulation
- Carrier frequency range (for modulation and audio measurements)
- (1/2 × audio analysis bandwidth) to maximum input frequency
- Maximum audio frequency span
- 10 MHz
- Audio filters
- Low pass (kHz)
- 0.3, 3, 15, 30, 80, 300, and user-entered up to 0.9 × audio bandwidth
- High pass (Hz)
- 20, 50, 300, 400, and user-entered up to 0.9 × audio bandwidth
- Standard
- CCITT, C-Message
- De-emphasis (μs)
- 25, 50, 75, 750, and user-entered
- File
- User-supplied .TXT or .CSV file of amplitude/frequency pairs. Maximum 1000 pairs
- FM Modulation Analysis (Modulation Index >0.1)
- FM measurements
- Carrier Power, Carrier Frequency Error, Audio Frequency, Deviation (+Peak, -Peak, Peak-Peak/2, RMS), SINAD, Modulation Distortion, S/N, Total Harmonic Distortion, Total Non-harmonic Distortion, Hum and Noise
- Carrier power accuracy (10 MHz to 2 GHz, -20 to 0 dBm input power)
- ±0.85 dB
- Carrier frequency accuracy (deviation: 1 to 10 kHz)
- ±0.5 Hz + (transmitter frequency × reference frequency error)
- FM deviation accuracy (rate: 1 kHz to 1 MHz)
- ±(1% of (rate + deviation) + 50 Hz)
- FM rate accuracy (deviation: 1 to 100 kHz)
- ±0.2 Hz
- Residuals (FM) (rate: 1 to 10 kHz, deviation: 5 kHz)
- THD
- 0.10%
- Distortion
- 0.7%
- SINAD
- 43 dB
- AM modulation analysis
- AM measurements
- Carrier Power, Audio Frequency, Modulation Depth (+Peak, –Peak, Peak-Peak/2, RMS), SINAD, Modulation Distortion, S/N, Total Harmonic Distortion, Total Non-harmonic Distortion, Hum and Noise
- Carrier power accuracy (10 MHz to 2 GHz, –20 to 0 dBm input power)
- ±0.85 dB
- AM depth accuracy (rate: 1 to 100 kHz, depth: 10% to 90%)
- ±0.2% + 0.01 × measured value
- AM rate accuracy (rate: 1 kHz to 1 MHz, depth: 50%)
- ±0.2 Hz
- Residuals (AM)
- THD
- 0.16%
- Distortion
- 0.13%
- SINAD
- 58 dB
- PM modulation analysis
- PM measurements
- Carrier Power, Carrier Frequency Error, Audio Frequency, Deviation (+Peak, -Peak, Peak-Peak/2, RMS), SINAD, Modulation Distortion, S/N, Total Harmonic Distortion, Total Non-harmonic Distortion, Hum and Noise
- Carrier power accuracy (10 MHz to 2 GHz, -20 to 0 dBm input power)
- ±0.85 dB
- Carrier frequency accuracy (deviation: 0.628 rad)
- ±0.02 Hz + (transmitter frequency × reference frequency error)
- PM deviation accuracy (rate: 10 to 20 kHz, deviation: 0.628 to 6 rad)
- ±100% × (0.005 + (rate / 1 MHz))
- PM rate accuracy (rate: 1 to 10 kHz, deviation: 0.628 rad)
- ±0.2 Hz
- Residuals (PM) (rate: 1 to 10 kHz, deviation: 0.628 rad)
- THD
- 0.1%
- Distortion
- 1%
- SINAD
- 40 dB
- Direct audio input
- Audio measurements
- Signal power, Audio frequency (+Peak, –Peak, Peak-Peak/2, RMS), SINAD, Modulation distortion, S/N, Total harmonic distortion, Total non-harmonic distortion, Hum and Noise
- Direct input frequency range (for audio measurements only)
- 1 Hz to 156 kHz
- Maximum audio frequency span
- 156 kHz
- Audio frequency accuracy
- ±0.2 Hz
- Signal power accuracy
- ±1.5 dB
- Residuals (Rate: 1 to 10 kHz, Input level: 0.316 V)
- THD
- 0.1%
- Distortion
- 0.1%
- SINAD
- 60 dB
Phase noise and jitter measurement (Opt. 11)
- Carrier frequency range
- 1 MHz to maximum instrument frequency
- Measurements
- Carrier power, Frequency error, RMS phase noise, Jitter (time interval error), Residual FM
- Residual Phase Noise
- See Phase noise specifications
- Phase noise and jitter integration bandwidth range
- Minimum offset from carrier: 10 Hz
- Maximum offset from carrier: 1 GHz
- Number of traces
- 2
- Trace and measurement functions
- Detection: average or ±Peak
- Smoothing Averaging
- Optimization: speed or dynamic range
Settling time, frequency, and phase (Opt. 12)18
- Settled frequency uncertainty
- 95% confidence (typical), at stated measurement frequencies, bandwidths, and # of averages
Frequency uncertainty at stated measurement bandwidth Measurement frequency, averages 85 MHz 10 MHz 1 MHz 100 kHz 1 GHz Single measurement 2 kHz 100 Hz 10 Hz 1 Hz 100 averages 200 Hz 10 Hz 1 Hz 0.1 Hz 1000 averages 50 Hz 2 Hz 1 Hz 0.05 Hz 10 GHz Single measurement 5 kHz 100 Hz 10 Hz 5 Hz 100 averages 300 Hz 10 Hz 1 Hz 0.5 Hz 1000 averages 100 Hz 5 Hz 0.5 Hz 0.1 Hz 20 GHz Single measurement 2 kHz 100 Hz 10 Hz 5 Hz 100 averages 200 Hz 10 Hz 1 Hz 0.5 Hz 1000 averages 100 Hz 5 Hz 0.5 Hz 0.2 Hz
- Settled phase uncertainty
- 95% confidence (Typical), at stated measurement frequencies, bandwidths, and # of averages
Frequency uncertainty at stated measurement bandwidth Measurement frequency, averages 85 MHz 10 MHz 1 MHz 1 GHz Single measurement 1.00° 0.50° 0.50° 100 averages 0.10° 0.05° 0.05° 1000 averages 0.05° 0.01° 0.01° 10 GHz Single measurement 1.50° 1.00° 0.50° 100 averages 0.20° 0.10° 0.05° 1000 averages 0.10° 0.05° 0.02° 20 GHz Single measurement 1.00° 0.50° 0.50° 100 averages 0.10° 0.05° 0.05° 1000 averages 0.05° 0.02° 0.02°
Gain and Noise Figure (Option 14)
- Measurements (tabular)
- Noise Figure, Gain, Y-Factor, Noise Temperature, P-Hot, P-Cold
- Measurements (displays)
- Noise Figure, Gain, Y-Factor, Noise Temperature, Uncertainty Calculator
- Single frequency measurements
- When Single Frequency mode is selected, each display acts as a meter and single-value readout for each selected trace in the measurement
- Measurement configurations
- Direct, Up-Converter, Down-Converter
- Frequency modes
- Single Frequency, Swept (Center+Span or Start-Stop), Frequency Table; 1 to 999 measurement points
- Noise source
- Constant ENR or tabular entry; entry fields for noise source model and type
- Noise sources supported
- NoiseCom NC346 series and similar models from other manufacturers
- Noise source control
- +28 V switched output, rear panel
- External gain/loss tables
- 3 tables or constants available for gain or loss
- Measurement control settings
- Source settling time, reference temperature, RBW(50 Hz to 10 MHz), Average count(1 to 100)
- Instrument input control settings
- Attenuator value, Preamp On/Off
- Trace controls
- 3 traces per display: Ave(VRMS), Max-hold, Min-hold trace functions
- Display scaling
- Auto or manual: Auto resets scale after each measurement
- Markers
- Up to 5 markers on any trace; Absolute and Delta marker functions
- Limit mask testing
- Positive and negative limits may be applied to noise figure, gain, Y-factor traces; limits and Pass/Fail indicated on screen
- Uncertainty calculator
- Provides noise figure and gain measurement uncertainty based on user-entered values for ENR, external preamp, external preamp, and spectrum analyzer parameters
- Application preset for Noise Figure and Gain
- Sets the analyzer to measure Gain, Noise Figure, and the Measurement Table. Sets attenuation to zero, preamplifier ON, and acquisition mode to best for minimum noise
- Performance
Specification Description Frequency range 10 MHz to maximum frequency of instrument (nominal) Noise figure measurement range 0 to 30 dB (nominal) Gain measurement range -10 to 30 dB (nominal) Noise figure and gain measurement resolution 0.01 dB (nominal) Noise figure measurement error ±0.1 dB (typical) 19 Gain measurement error ±0.1 dB (typical) 19 Note: These conditions for Noise Figure and Gain specifications apply: Operating temperature 18 to 28 deg. C, after 20 minute warmup with internal preamp ON, immediately after internal alignment. Specified error includes only the error of the spectrum analyzer. Uncertainty from errors in ENR source level, external amplifier gain, low SN ratio and measurement system mismatch are not included, and can all be estimated using the uncertainty calculator included in the software.
Pulse measurements (Opt. 20)
- Measurements
- Average on power, Peak power, Average transmitted power, Pulse width, Rise time, Fall time, Repetition interval (seconds), Repetition rate (Hz), Duty factor (%), Duty factor (ratio), Ripple (dB), Ripple (%), Droop (dB), Droop (%), Overshoot (dB), Overshoot (%), Pulse frequency, Delta frequency, Pulse-Ref Pulse frequency difference, Pulse-Ref Pulse Phase difference, Pulse-Pulse frequency difference, Pulse-Pulse phase difference, RMS frequency error, Max frequency error, RMS phase error, Max phase error, Frequency deviation, Phase deviation, Impulse response (dB), Impulse response (time), Time stamp
- Minimum pulse width for detection
- 150 ns (Opt. B25/B40), 50 ns (Opt. B85/B16x)
- Number of pulses20
- 1 to 200,000; offline analysis of more than 40,000 continuous pulses is recommended using fast frame mode and fast save option
- System rise time (typical)
- <40 ns (Opt. B25), <25 ns (Opt. B40), <12 ns (Opt. B85), <7 ns (Opt. B16x)
- Pulse measurement accuracy
- Signal conditions: Unless otherwise stated, Pulse width >450 ns (150 ns, Opt. B85/B16x), S/N Ratio ≥30 dB, Duty cycle 0.5 to 0.001, Temperature 18 °C to 28 °C
- Impulse response
Measurement range: 15 to 40 dB across the width of the chirp
Measurement accuracy (typical): ±2 dB for a signal 40 dB in amplitude and delayed 1% to 40% of the pulse chirp width 21
- Impulse response weighting
- Taylor window
Pulse measurement performance
- Pulse amplitude and timing (typical)
- Average on power22
- ±0.3 dB + Absolute amplitude accuracy
- Average transmitted power22
- ±0.4 dB + Absolute amplitude accuracy
- Peak power22
- ±0.4 dB + Absolute amplitude accuracy
- Pulse width
- ±0.25% of reading
- Duty factor
- ±0.2% of reading
- Frequency and phase error referenced to nonchirped signal
- At stated frequencies and measurement bandwidths 23, typical, 95% confidence
Bandwidth CF RMS frequency error Pulse to pulse frequency Pulse to pulse delta frequency Pulse to pulse phase 25 MHz 2 GHz ±2.5 kHz ±15 kHz ±500 Hz ±0.2° 10 GHz ±2.5 kHz ±20 kHz ±1.5 kHz ±0.5° 20 GHz ±3.5 kHz ±25 kHz ±2 kHz ±0.8° 40 MHz 2 GHz ±3.5 kHz ±20 kHz ±1 kHz ±0.2° 10 GHz ±5 kHz ±30 kHz ±2 kHz ±0.5° 20 GHz ±7.5 kHz ±40 kHz ±3 kHz ±0.8° 60 MHz 2 GHz ±8 kHz ±50 kHz ±1.5 kHz ±0.3° 10 GHz ±15 kHz ±75 kHz ±3 kHz ±0.5° 20 GHz ±20 kHz ±100 kHz ±4 kHz ±0.8° 85 MHz 2 GHz ±15 kHz ±100 kHz ±2 kHz ±0.3° 10 GHz ±20 kHz ±125 kHz ±3 kHz ±0.5° 20 GHz ±25 kHz ±175 kHz ±4 kHz ±0.8° 160 MHz 2 GHz ±20 kHz ±100 kHz ±4.5 kHz ±0.3° 10 GHz ±25 kHz ±125 kHz ±6 kHz ±0.5° 20 GHz ±40 kHz ±175 kHz ±8 kHz ±0.8°
- Frequency and phase error referenced to a linear chirp
- At stated frequencies and measurement bandwidths 24, typical
Bandwidth CF RMS frequency error Pulse to pulse frequency Pulse to pulse phase 25 MHz 2 GHz ±5 kHz ±15 kHz ±0.25° 10 GHz ±8 kHz ±20 kHz ±0.5° 20 GHz ±10 kHz ±25 kHz ±0.8° 40 MHz 2 GHz ±5 kHz ±20 kHz ±0.25° 10 GHz ±8 kHz ±30 kHz ±0.5° 20 GHz ±10 kHz ±50 kHz ±0.8° 60 MHz 2 GHz ±25 kHz ±125 kHz ±0.3° 10 GHz ±30 kHz ±150 kHz ±0.5° 20 GHz ±30 kHz ±150 kHz ±0.8° 85 MHz 2 GHz ±25 kHz ±125 kHz ±0.3° 10 GHz ±30 kHz ±150 kHz ±0.5° 20 GHz ±30 kHz ±175 kHz ±0.8° 160 MHz 2 GHz ±35 kHz ±125 kHz ±0.3° 10 GHz ±40 kHz ±150 kHz ±0.5° 20 GHz ±40 kHz ±200 kHz ±0.8°
Digital modulation analysis (Opt. 21)
- Modulation formats
- π/2DBPSK, BPSK, SBPSK, QPSK, DQPSK, π/4DQPSK, D8PSK, D16PSK, 8PSK, OQPSK, SOQPSK, CPM, 16/32-APSK, 16/32/64/128/256QAM, MSK, GMSK, 2-FSK, 4-FSK, 8-FSK, 16-FSK, C4FM
- Analysis period
- Up to 81,000 samples
- Filter types
- Measurement filters
- Square-root raised cosine, Raised cosine, Gaussian, Rectangular, IS-95, IS-95 EQ, C4FM-P25, Half-sine, None, User defined
- Reference filters
- Raised cosine, Gaussian, Rectangular, IS-95, SBPSK-MIL, SOQPSK-MIL, SOQPSK-ARTM, none, user defined
- Alpha/B*T range
- 0.001 to 1, 0.001 step
- Measurements
- Constellation, Error Vector Magnitude (EVM) vs. Time, Modulation error ratio (MER), Magnitude error vs. Time, Phase error vs. Time, Signal quality, Symbol table, Rho
- FSK only: Frequency deviation, Symbol timing error
- Symbol rate range
- 1 kS/s to 100 MS/s (modulated signal must be contained entirely within acquisition BW of the instrument)
- QPSK residual EVM25
- 100 kHz symbol rate
- <0.35%
- 1 MHz symbol rate
- <0.35%
- 10 MHz symbol rate
- <0.4%
- 30 MHz symbol rate (Opt. B40/B85/B16x)
- <0.75%
- 60 MHz symbol rate (Opt. B85/B16x)
- <1.0%
- 120 MHz symbol rate (Opt. B16x)
- <1.5%
- Offset QPSK residual EVM25
- 100 kHz symbol rate, 200 kHz measurement BW
- <0.5%
- 1 MHz symbol rate, 2 MHz measurement BW
- <0.5%
- 10 MHz symbol rate, 20 MHz measurement BW
- <1.1%
- 256 QAM residual EVM26
- 10 MHz symbol rate
- <0.4%
- 30 MHz symbol rate (Opt. B40/B85/B16x)
- <0.6%
- 60 MHz symbol rate (Opt. B85/B16x)
- <0.6%
- 120 MHz symbol rate (Opt. B16x)
- <1.0%
- S-OQPSK (MIL) residual EVM27
- 4 kHz symbol rate, 64 kHz measurement bandwidth, CF = 250 MHz
- <0.3%
- 20 kHz symbol rate, 320 kHz measurement bandwidth, CF = 2 GHz
- <0.5%
- 100 kHz symbol rate, 1.6 MHz measurement bandwidth, CF = 2 GHz
- <0.5%
- 1 MHz symbol rate, 16 MHz measurement bandwidth, CF = 2 GHz
- <0.5%
- S-OQPSK (ARTM) residual EVM27
- 4 kHz symbol rate, 64 kHz measurement bandwidth, CF = 250 MHz
- <0.3%
- 20 kHz symbol rate, 320 kHz measurement bandwidth, CF = 2 GHz
- <0.4%
- 100 kHz symbol rate, 1.6 MHz measurement bandwidth, CF = 2 GHz
- <0.4%
- 1 MHz symbol rate, 16 MHz measurement bandwidth, CF = 2 GHz
- <0.4%
- S-BPSK (MIL) residual EVM28
- 4 kHz symbol rate, 64 kHz measurement bandwidth, CF = 250 MHz
- <0.25%
- 20 kHz symbol rate, 320 kHz measurement bandwidth, CF = 2 GHz
- <0.5%
- 100 kHz symbol rate, 1.6 MHz measurement bandwidth, CF = 2 GHz
- <0.5%
- 1 MHz symbol rate, 1.6 MHz measurement bandwidth, CF = 2 GHz
- <0.5%
- CPM (MIL) residual EVM28
- 4 kHz symbol rate, 64 kHz measurement bandwidth, CF = 250 MHz
- <0.3%
- 20 kHz symbol rate, 320 kHz measurement bandwidth, CF = 2 GHz
- <0.4%
- 100 kHz symbol rate, 1.6 MHz measurement bandwidth, CF = 2 GHz
- <0.4%
- 1 MHz symbol rate, 16 MHz measurement bandwidth, CF = 2 GHz
- <0.4%
- 2/4/8/16 FSK residual RMS FSK error29
- 2FSK, 10 kHz symbol rate, 10 kHz frequency deviation, CF = 2 GHz
- <0.3%
- 4/8/16FSK, 10 kHz symbol rate, 10 kHz frequency deviation, CF = 2 GHz
- <0.4%
Adaptive equalizer
- Type
- Linear, decision-directed, feed-forward (FIR) equalizer with co-efficient adaptation and adjustable convergence rate
- Modulation types supported
- BPSK, QPSK, OQPSK, π/2DBPSK, π/4DQPSK, 8PSK, 8DPSK, 16DPSK, 16/32/64/128/256QAM
- Reference filters for all modulation types except OQPSK
- Raised cosine, rectangular, none
- Reference filters for OQPSK
- Raised cosine, half sine
- Filter length
- 3 to 2001 taps
- Taps/Symbol: raised cosine, half sine
- 1, 2, 4, 8
- Taps/Symbol: rectangular filter, no filter
- 1
- Equalizer controls
- Off, train, hold, reset
Flexible OFDM (Opt. 22)
- Recallable standards
- WiMAX 802.16-2004, WLAN 802.11 a/g/j
- Parameter settings
- Guard interval, subcarrier spacing, channel bandwidth
- Advanced parameter settings
Carrier detect: 802.11, 802.16-2004 - Auto-detect; Manual select BPSK; QPSK, 16QAM, 64QAM
Channel estimation: Preamble, Preamble + Data
Pilot tracking: Phase, Amplitude, Timing
Frequency correction: On, Off
- Summary measurements
Symbol clock error, Frequency error, Average power, Peak-to-Average, CPE
EVM (RMS and peak) for all carriers, plot carriers, data carriers
OFDM parameters: Number of carriers, Guard interval (%), Subcarrier spacing (Hz), FFT Length
Power (Average, Peak-to-Average)
- Displays
- EVM vs symbol, vs subcarrier
- Subcarrier power vs symbol, vs subcarrier
- Mag error vs symbol, vs subcarrier
- Phase error vs symbol, vs subcarrier
- Channel frequency response
- Residual EVM
- -49 dB (WiMAX 802.16-2004, 5 MHz BW)
- -49 dB (WLAN 802.11g, 20 MHz BW)
- Signal input power optimized for best EVM
WLAN IEEE802.11a/b/g/j/p (Opt. 23)
- Modulation formats
- DBPSK (DSSS-1M), DQPSK (DSSS-2M), CCK 5.5M, CCK 11M , OFDM (BPSK, QPSK, 16QAM, 64QAM)
- Measurements and displays
Burst index, Burst power, Peak to average burst power, IQ origin offset, Frequency error, Common pilot error, Symbol clock error
RMS and Peak EVM for Pilots/Data, Peak EVM located per symbol and subcarrier
Packet header format information
Average power and RMS EVM per section of the header
WLAN power vs time, WLAN symbol table, WLAN constellation
Spectrum emission mask, spurious
Error Vector Magnitude (EVM) vs symbol (or time), vs subcarrier (or frequency)
Mag error vs symbol (or time), vs subcarrier (or frequency)
Phase error vs symbol (or time), vs subcarrier (or frequency)
WLAN channel frequency response vs symbol (or time), vs subcarrier (or frequency)
WLAN spectral flatness vs symbol (or time), vs subcarrier (or frequency)
- Residual EVM - 802.11b (CCK-11 Mbps)
- RMS-EVM over 1000 chips, EQ On
Signal input power optimized for best EVM
- 2.4 GHz:
- 1%(–40 dB) typical, 0.9% (–40.9 dB) typical-mean
- Residual EVM - 802.11a/g/j (OFDM, 20 MHz, 64-QAM)
- RMS-EVM averaged over 20 bursts, 16 symbols each
- Signal input power optimized for best EVM
- 2.4 GHz
- –49 dB typical, –50 dB typical-mean
- 5.8 GHz
- –49 dB typical, –50 dB typical-mean
WLAN IEEE802.11n (Opt. 24)
- Modulation formats
- OFDM (BPSK, QPSK, 16 or 64QAM)
- Measurements and displays
Burst index, Burst power, Peak to average burst power, IQ origin offset, Frequency error, Common pilot error, Symbol clock error
RMS and Peak EVM for Pilots/Data, Peak EVM located per symbol and subcarrier
Packet header format information
Average power and RMS EVM per section of the header
WLAN power vs time, WLAN symbol table, WLAN constellation
Spectrum emission mask, spurious
Error Vector Magnitude (EVM) vs symbol (or time), vs subcarrier (or frequency)
Mag error vs symbol (or time), vs subcarrier (or frequency)
Phase error vs symbol (or time), vs subcarrier (or frequency)
WLAN channel frequency response vs symbol (or time), vs subcarrier (or frequency)
WLAN spectral flatness vs symbol (or time), vs subcarrier (or frequency)
- Residual EVM - 802.11n (40 MHz, 64-QAM)
- RMS-EVM over averaged over 20 bursts, 16 symbols each
- Signal input power optimized for best EVM
- 5.8 GHz
- –48 dB typical, –48.5 dB typical-mean
WLAN IEEE802.11ac (Opt. 25)
- Modulation formats
- OFDM (BPSK, QPSK, 16QAM, 64QAM, 256QAM)
- Measurements and displays
Burst index, Burst power, Peak to average burst power, IQ origin offset, Frequency error, Common pilot error, Symbol clock error
RMS and Peak EVM for Pilots/Data, Peak EVM located per symbol and subcarrier
Packet header format information
Average power and RMS EVM per section of the header
WLAN power vs time, WLAN symbol table, WLAN constellation
Spectrum emission mask, spurious
Error Vector Magnitude (EVM) vs symbol (or time), vs subcarrier (or frequency)
Mag error vs symbol (or time), vs subcarrier (or frequency)
Phase error vs symbol (or time), vs subcarrier (or frequency)
WLAN channel frequency response vs symbol (or time), vs subcarrier (or frequency)
WLAN spectral flatness vs symbol (or time), vs subcarrier (or frequency)
- Residual EVM - 802.11ac
- RMS-EVM averaged over 20 bursts, 16 symbols each
Signal input power optimized for best EVM
- 5.8 GHz (80 MHz, 256-QAM)
- –48 dB typical, –48.5 dB typical-mean
- 5.8 GHz (160 MHz, 256-QAM)
- –45 dB typical, –45.5 dB typical-mean
EMC pre-compliance and troubleshooting (Opt. 32)
- EMC pre-compliance and troubleshooting
- Standards
- EN55011, EN55012, EN55013, EN55014, EN55015, EN55025, EN55032, EN60601, DEF STAN, FCC Part 15, FCC Part18, MIL-STD 461G
- Features
- EMC-EMI display, Wizard to setup accessories and limit lines, Inspect, Harmonic Markers, Level Target, Compare Traces, Measure Ambient, Report generation, Re-measure Spot
- Detectors
+Peak, Avg, Avg (of logs), Avg (VRMS), CISPR QuasiPeak, CISPR Peak, CISPR Average, CISPR Average of Logs, MIL +Peak, DEF STAN Avg, DEF STAN Peak
- Limit lines
- Up to 3 Limit Lines with corresponding margins
- Resolution BW
- Set per standard or user definable
- Dwell time
- Set per standard or user definable
- Report format
- PDF, HTML, MHT,RTF, XLSX, Image File format
- Accessory type
- Antenna, Near Field Probe, Cable, Amplifier, Limiter, Attenuator, Filter, Other
- Correction format
- Gain/Loss Constant, Gain/loss table, Antenna Factor
- Traces
- Save/recall up to 5 traces, Math trace (trace1 minus trace2), Ambient trace
APCO P25 (Option 26)
- Modulation formats
- Phase 1 (C4FM), Phase 2 (HCPM, HDQPSK)
- Measurements and displays
- RF output power, operating frequency accuracy, modulation emission spectrum,
unwanted emissions spurious, adjacent channel power ratio, frequency deviation,
modulation fidelity, frequency error, eye diagram, symbol table, symbol rate accuracy,
transmitter power and encoder attack time, transmitter throughput delay, frequency
deviation vs. time, power vs. time, transient frequency behavior, HCPM transmitter logical
channel peak adjacent channel power ratio, HCPM transmitter logical channel off slot power,
HCPM transmitter logical channel power envelope, HCPM transmitter logical channel time alignment
- Residual modulation fidelity
- Phase 1 (C4FM)
- ≤1.0% typical
- Phase 2 (HCPM)
- ≤0.5% typical
- Phase 2 (HDQPSK)
- ≤0.4% typical
- Adjacent channel power ratio 30
- 25 kHz offset from the center and bandwidth of 6 kHz
- Phase 1 (C4FM): -74 dBc typical
- Phase 2 (HCPM): -74 dBc typical
- Phase 2 (HDQPSK): -75 dBc typical
- 62.5 kHz offset from the center and bandwidth of 6 kHz
- -75 dBc typical
Bluetooth (Options 27 and 31)
- Modulation formats Bluetooth
- Basic Rate, Bluetooth Low Energy, Enhanced Data Rate - Revision 4.2, Bluetooth® 5 when option 31 is enabled
- Measurements and displays
Peak power, average power, adjacent channel power or inband emission mask,
-20 dB bandwidth, frequency error, modulation characteristics including ΔF1avg (11110000),
ΔF2avg (10101010), ΔF2 > 115 kHz, ΔF2/ΔF1 ratio, frequency deviation vs. time with packet and octet
level measurement information, carrier frequency f0, frequency offset (Preamble and Payload), max
frequency offset, frequency drift f1-f0, max drift rate fn-f0 and fn-fn-5, center frequency
offset table and frequency drift table, color-coded symbol table, packet header decoding information,
eye diagram, constellation diagram
- Output power (average and peak)
- Level uncertainty
- Refer to instrument amplitude and flatness specification
- Measurement range
- > -70 dBm
- Modulation characteristics (ΔF1avg, ΔF2avg, ΔF2avg/ ΔF1avg, ΔF2max ≥115 kHz)
- Deviation range
- ± 280 kHz
- Deviation uncertainty (at 0 dBm)
- < 2 kHz + instrument freq. uncertainty
- Measurement resolution
- 10 Hz
- Measurement range
- Nominal channel frequency ±100 kHz
- Initial Carrier Frequency Tolerance (ICFT)
- Measurement uncertainty (at 0 dBm)
- <1 kHz + instrument frequency uncertainty
- Measurement resolution
- 10 Hz
- Measurement range
- Nominal channel frequency ±100 kHz
- Carrier frequency drift
- Supported measurements
Max freq. offset, drift f1- f0, max drift fn-f0, max drift fn-fn-5 (50 μs)
- Measurement uncertainty
- < 1 kHz + instrument frequency uncertainty
- Measurement resolution
- 10 Hz
- Measurement range
- Nominal channel frequency ±100 kHz
- In-band emissions and ACP
- Level uncertainty
- Refer to instrument amplitude and flatness specification
LTE Downlink RF measurements (Opt. 28)
- Standard Supported
- 3GPP TS 36.141 Version 12.5
- Frame Format supported
- FDD and TDD
- Measurements and Displays Supported
- Adjacent Channel Leakage Ratio (ACLR), Spectrum Emission Mask (SEM), Channel Power, Occupied Bandwidth (OBW), Error Vector Magnitude (EVM), Modulation Accuracy, Adjacent Channel Power (ACP), Power vs. Time is for uplink only showing Transmitter OFF power for TDD signals and LTE constellation diagram for PSS, SSS with Cell ID, Group ID, Sector ID, and Frequency Error.
- ACLR with E-UTRA bands (Nominal, with Noise Correction)
- 1st Adjacent Channel
- 73 dB
- 2nd Adjacent Channel
- 74 dB
5G NR Uplink/Downlink measurements (RSA5BUP Opt. 5GNR)
- Standard supported
- TS 38.141-1 for BS and 38.521-1 for UE
- Modulation accuracy
- Sec 6.5.2 for BS and Sec 6.4.2 for UE.
- ACP
- Sec 6.6.3 for BS and Sec 6.5.2.4 for UE
- Frame format supported
- Uplink (FDD and TDD)
- Downlink (FDD and TDD)
- Measurements and displays supported
- Channel Power (CHP), Adjacent Channel Power (ACP), Power Vs Time (PVT)2, Modulation Accuracy (including Error Vector Magnitude (EVM), Frequency Error, IQ Error), EVM vs. Symbol, Occupied Bandwidth (OBW), Spectral Emission Mask (SEM), Constellation Diagram, and summary table with scalar results.
- EVM (typical)
1 GHz 3.5 GHz 5 GHz 7 GHz 0.40% 0.41% 0.46% 0.53% For RSA5100B Series Spectrum Analyzers: ≤44.4 dB rms EVM from 1 GHz to 7 GHz

- ACLR (typical)
<-48dBc for 1GHz to 7 GHz , 100 MHz CC1, 256 QAM, -9 dBm to -27 dBm channel power, within -1 dB of full scale.
Mapping and field strength (Option MAP)
- RF field strength
- Signal strength indicator
- Located at right-side of display
- Measurement bandwidth
- Up to 165 MHz, dependent on span and RBW setting
- Tone type
- Variable frequency
- Mapping
- Map types directly supported
- Pitney Bowes MapInfo (*.mif), Bitmap (*.bmp), Open Street Maps (.osm)
- Saved measurement results
Measurement data files (exported results)
Map file used for the measurements
Google earth KMZ file
Recallable results files (trace and setup files)
MapInfo-compatible MIF/MID files
Analog modulation analysis accuracy (typical)
- AM
- ±2% (0 dBm input at center, carrier frequency 1 GHz, 10 to 60% modulation depth)
- FM
- ±1% of span (0 dBm input at center)
- (Carrier frequency 1 GHz, 400 Hz/1 kHz Input/Modulated frequency)
- PM
- ±3° (0 dBm input at center)
- (Carrier frequency 1 GHz, 1 kHz/5 kHz Input/Modulated frequency)
Inputs and outputs
- Front panel
- Display
- Touch panel, 10.4 in. (264 mm)
- RF input connector
- N-type female, 50 Ω (RSA5103B, RSA5106B)
- N-Type Female Planar Crown (RSA5115B)
- 3.5mm Female Planar Crown (RSA5126B)
- Trigger out
- BNC, High: >2.0 V, Low: <0.4 V, Output current 1 mA (LVTTL)
- Trigger in
- BNC, 50 Ω/5 kΩ impedance (nominal), ±5 V max input, -2.5 V to +2.5 V trigger level
- USB ports
- (2) USB 2.0
- Audio
- Speaker
- Rear panel
- 10 MHz REF OUT
- 50 Ω, BNC, >0 dBm
- External REF IN
- 50 Ω, 10 MHz, BNC
- Trig 2 / gate IN
- BNC, High: 1.6 to 5.0 V, Low: 0 to 0.5 V
- GPIB interface
- IEEE 488.2
- LAN interface ethernet
- RJ45, 10/100/1000BASE-T
- USB ports
- (2) USB 2.0
- VGA output
- VGA compatible, 15 DSUB
- Audio out
- 3.5 mm headphone jack
- Noise source drive
- BNC, +28 V, 140 mA (nominal)
- Turn ON time: 100 μs, Turn OFF time: 500 μs
- Digital I and Q out
- 2 connectors, LVDS (Opt. 65)
- Analog Zero Span Out
- 1 connector, BNC (Opt. 66)
General characteristics
- Temperature range
- Operating
- +5 °C to +40 °C
- Storage
- –20 °C to +60 °C
- Warm-up time
- 20 minutes
- Altitude
- Operating
- Up to 3000 m (approximately 10,000 ft.)
- Nonoperating
- Up to 12,190 m (40,000 ft.)
- Relative humidity
- Operating and nonoperating
- +40 °C at 95% relative humidity, meets intent of EN 60068-2-30.31
- Vibration
- Operating (except when equipped with option 56 removable SSD)
- 0.22GRMS . Profile = 0.00010 g2 /Hz at 5-350 Hz, -3 dB/Octave slope from 350-500 Hz, 0.00007 g2 /Hz at 500 Hz, 3 Axes at 10 min/axis
- Nonoperating
- 2.28GRMS . Profile = 0.0175 g2 /Hz at 5-100 Hz, -3 dB/Octave slope from 100-200 Hz, 0.00875 g2 /Hz at 200-350 Hz,-3 dB/Octave slope from 350-500 Hz, 0.006132 g2 /Hz at 500 Hz, 3 Axes at 10 min/axis
- Shock
- Operating
- 15 G, half-sine, 11 ms duration, three shocks per axis in each direction (18 shocks total)
- Nonoperating
- 30 G, half-sine, 11 ms duration, three shocks per axis in each direction (18 shocks total)
- Data storage
- Internal HDD (Opt. 61), USB ports, removable SSD (Opt. 60)
Power
- Power requirements
90 VAC to 264 VAC, 50 Hz to 60 Hz
90 VAC to 132 VAC, 400 Hz
- Power consumption
- 400 W max
EMC and safety compliance
- Safety
- UL 61010-1:2004
- CSA C22.2 No.61010-1-04
- Electromagnetic compatibility, complies with
- EU council EMC Directive 2004/108/EC
- EN61326, CISPR 11, Class A
- ACMA (Australia/New Zealand)
- FCC 47CFR, Part 15, Subpart B, Class A (USA)
Physical characteristics
With feet
- Dimensions (with feet)
- Height
- 282 mm (11.1 in.)
- Width
- 473 mm (18.6 in.)
- Depth
- 531 mm (20.9 in.)
- Weight
- 29 kg (64.7 lb.) With all options.
Ordering information
Models
- RSA5103B
- Real Time Signal Analyzer, 1 Hz to 3 GHz
- RSA5106B
- Real Time Signal Analyzer, 1 Hz to 6.2 GHz
- RSA5115B
- Real Time Signal Analyzer, 1 Hz to 15 GHz
- RSA5126B
- Real Time Signal Analyzer, 1 Hz to 26.5 GHz
All Include: Quick-start Manual (Printed), Application Guide, Printable Online Help File, Programmer's manual (on CD), power cord, BNC-N adapter, Front Cover.
RSA5115B also includes: Planar Crown RF Input Connector - Type N Female PN 131-4329-00
RSA5126B also includes: Planar Crown RF Input Connector - 3.5 mm Female
Note: Please specify power plug and language options when ordering.
Warranty
Options, accessories, and upgrades
Options
| Product | Options | Description |
|---|---|---|
| RSA5103B | Real Time Signal Analyzer, 1 Hz to 3 GHz | |
| RSA5106B | Real Time Signal Analyzer, 1 Hz to 6.2 GHz | |
| RSA5115B | Real Time Signal Analyzer, 1 Hz to 15 GHz | |
| RSA5126B | Real Time Signal Analyzer, 1 Hz to 26.5 GHz | |
| Opt. B25 | 25 MHz Acquisition Bandwidth (no-cost option) | |
| Opt. B40 | 40 MHz Acquisition Bandwidth | |
| Opt. B85 | 85 MHz Acquisition Bandwidth | |
| Opt. B125 | 125 MHz Acquisition Bandwidth | |
| Opt. B16x | 165 MHz Acquisition Bandwidth | |
| Opt. B85HD | 85 MHz Acquisition Bandwidth, High Dynamic Range | |
| Opt. B125HD | 125 MHz Acquisition Bandwidth, High Dynamic Range | |
| Opt. B16xHD | 165 MHz Acquisition Bandwidth, High Dynamic Range | |
| Opt. 300 | High performance real time (Opt. 09 required) | |
| Opt. 09 | Enhanced Real Time | |
| Opt. 10 | AM/FM/PM Modulation and Audio Measurements (Opt. 300 required) | |
| Opt. 11 | Phase Noise / Jitter Measurement | |
| Opt. 12 | Settling Time (Frequency and Phase) | |
| Opt. 14 | Noise Figure and Gain (Internal preamp recommended) | |
| Opt. 20 | Pulse Measurements | |
| Opt. 21 | General Purpose Modulation Analysis | |
| Opt. 22 | Flexible OFDM Analysis | |
| Opt. 23 | WLAN 802.11a/b/g/j/p measurement application | |
| Opt. 24 | WLAN 802.11n measurement application (requires opt 23) | |
| Opt. 25 | WLAN 802.11ac measurement application (requires opt 24) | |
| Opt. 26 | APCO P25 measurement application | |
| Opt. 27 | Bluetooth Basic LE Tx Measurements | |
| Opt. 28 | LTE Downlink RF measurements | |
| Opt. 31 | Bluetooth 5 Measurements
(requires opt 27) | |
| Opt. 32 | EMC pre-compliance and troubleshooting | |
| Opt. MAP | Mapping and signal strength | |
| Opt. 50 | Internal Preamp, 1 MHz to 3/6.2 GHz, RSA5103B/5106B only | |
| Opt. 51 | Internal Preamp, 1 MHz to 15/26.5 GHz, RSA5115B/5126B only | |
| Opt. 53 | Memory Extension, 4 GB Acquisition Memory Total | |
| Opt. 6032 | Removable SSD, incompatible with Opt. 61 | |
| Opt. 6132 | Internal HDD, incompatible with Opt. 60 (no cost option) | |
| Opt. 65 | Digital I and Q outputs | |
| Opt. 66 | Zero-span analog output | |
| Opt. 6566 | Digital I and Q outputs and Zero-span analog output | |
| Opt. PFR | Precision Frequency Reference | |
| Opt. 54 | Signal Classification and Survey |
International power plugs
- Opt. A0
- North America power plug (115 V, 60 Hz)
- Opt. A1
- Universal Euro power plug (220 V, 50 Hz)
- Opt. A2
- United Kingdom power plug (240 V, 50 Hz)
- Opt. A3
- Australia power plug (240 V, 50 Hz)
- Opt. A4
- North America power plug (240 V, 50 Hz)
- Opt. A5
- Switzerland power plug (220 V, 50 Hz)
- Opt. A6
- Japan power plug (100 V, 50/60 Hz)
- Opt. A10
- China power plug (50 Hz)
- Opt. A11
- India power plug (50 Hz)
- Opt. A12
- Brazil power plug (60 Hz)
- Opt. A99
- No power cord
Language options
- Opt. L0
- English manual
- Opt. L3
- Japanese manual
- Opt. L5
- Simplified Chinese manual
- Opt. L7
- Russian manual
Service options
- Opt. C3
- Calibration Service 3 Years
- Opt. C5
- Calibration Service 5 Years
- Opt. CA1
- Single Calibration or Functional Verification
- Opt. D1
- Calibration Data Report
- Opt. D3
- Calibration Data Report 3 Years (with Opt. C3)
- Opt. D5
- Calibration Data Report 5 Years (with Opt. C5)
- Opt. G3
- Complete Care 3 Years (includes loaner, scheduled calibration, and more)
- Opt. G5
- Complete Care 5 Years (includes loaner, scheduled calibration, and more)
- Opt. R5
- Repair Service 5 Years (including warranty)
Recommended accessories
- RTPA2A Spectrum Analyzer Probe Adapter compatibility
- Supports TekConnect® probes.
- Compatibility: P7225 - 2.5 GHz Active Probe, P7240 - 4 GHz Active Probe, P7260 - 6 GHz Active Probe, P7330 - 3.5 GHz Differential Probe, P7350 - 5 GHz Differential Probe, P7350SMA - 5 GHz Differential SMA Probe, P7340A - 4 GHz Z-Active Differential Probe, P7360A - 6 GHz Z-Active Differential Probe, P7380A - 8 GHz Z-Active Differential Probe, P7380SMA - 8 GHz Differential Signal Acquisition System, P7313 - >12.5 GHz Z-Active Differential Probe, P7313SMA - 13 GHz Differential SMA Probe, P7500 Series - 4 GHz to 20 GHz TriMode Probes
- SignalVu-PC
- Software based on the RSA5000 Series Real Time Spectrum Analyzers puts the power of your RTSA signal analysis tools on your Windows 64-bit PC. Performs measurements on stored signals from RSA3000/5000/6000 series, RSA306/306B, RSA500A/600A series, RSA7100A, and MDO4000B/C oscilloscope RF captures.
- Additional Removable Hard Drive
- Order RSA5BUP Opt. SSD. This is an additional solid-state drive for instrument with Option 56 installed. (Windows 7 and instrument software preinstalled).
- DC Block
- Order 119-7902-00. 9 kHz-18 GHz. Type N Male to Type N Female. Voltage Rating: 50 V DC Max. Insertion Loss 0.9 dB. Aeroflex model 7003.
- EMI-NF-PROBE
- Near Field Probe set
- Noise source
- NoiseCom NC346C Series. Provides supported sources up to 55 GHz in a variety of connector types and ENR values. Contact NoiseCom for full information and to order: http://noisecom.com
- 131-4329-xx
- Planar Crown RF Input Connector - 7005A-3 Type-N Female
- 600 Ω BNC pass-through
- Required for higher-speed noise figure measurements when ordering RSA5UP Opt 14 for RSA5000A. POMONA 4119-600 RF/COAXIAL ADAPTER, BNC PLUG-BNC JACK. Contact Pomona Electronics and distributors worldwide to order: http://pomonaelectronics.com
- 131-9062-xx
- Planar Crown RF Input Connector - 7005A-6 3.5 mm Female
- 131-8822-xx
- Planar Crown RF Input Connector - 7005A-7 3.5 mm Male
- 131-8689-xx
- Planar Crown RF Input Connector – 7005A-1 SMA Female
- 015-0369-xx
- RF Adapter – N (male) to SMA (male)
- 119-6599-xx
- Power Attenuator – 20 dB, 50 W, 5 GHz
- Transit Case
- 016-2026-xx
- RSA56KR
- Rackmount Retrofit
- Additional Quick-start Manual (Paper)
- 071-3224-xx
- Additional Application Examples Manual (Paper)
- 071-3283-xx
EMC accessories available from Com-Powerwww.com-power.com:
- CLCE-400
- RF current probe 10 kHz to 400 MHz
- ABF-900A
- Biconical antenna 25 MHz to 300 MHz
- ALC-100
- Compact Log Periodic antenna 300 MHz to 1 GHz
- PAM-103
- Preamplifier 1 MHz to 1 GHz
- AT-812
- Antenna Tripod 0.8 to 1.5m height range
EMC accessories available from Tekboxwww.tekbox.com:
RSA5BUP – Upgrade options for the RSA5100B series
| RSA5BUP | Option description | HW or SW | Factory calibration required? |
|---|---|---|---|
| Opt. PFR | Precision Frequency Reference | HW | Yes |
| Opt. SSD | Additional removable solid-state drive for units equipped with Option 56. Minimum capacity 480 GB. Windows 7 and instrument software preinstalled. | HW | No |
| Opt. 50 | Internal Preamp 1 MHz to 3 GHz (RSA5103B) or 1 MHz to 6.2 GHz (RSA5106B) | HW | Yes |
| Opt. 51 | Internal Preamp 1 MHz to 15 GHz (RSA5115B) or 1 MHz to 26.5 GHz (RSA5126B) | SW | No |
| Opt. 53 | Memory Extension, 4 GB Acquisition Memory total | HW | No |
| Opt. 54 | Signal Classification and Survey | SW | No |
| Opt. 65 | Digital I and Q outputs | HW | No |
| Opt. 66 | Zero-span analog output | HW | No |
| Opt. 6566 | Digital I and Q outputs and Zero-span analog output | HW | No |
| Opt. 60 | Removable Solid-State Drive (460 GB), incompatible with Opt. 61 | HW | No |
| Opt. 61 | Internal HDD (160 GB), incompatible with Opt. 60 | HW | No |
| Opt. 09 | Enhanced Real Time | SW | No |
| Opt. 10 | AM/FM/PM Modulation and Audio Measurements (requires opt 300) | SW | No |
| Opt. 11 | Phase Noise / Jitter Measurements | SW | No |
| Opt. 12 | Settling Time (Frequency and Phase) | SW | No |
| Opt. 14 | Noise Figure and Gain (Internal preamp recommended) | SW | No |
| Opt. 20 | Pulse Measurements | SW | No |
| Opt. 21 | General Purpose Modulation Analysis | SW | No |
| Opt. 22 | Flexible OFDM Analysis | SW | No |
| Opt. 23 | WLAN 802.11a/b/g/j/p measurement application | SW | No |
| Opt. 24 | WLAN 802.11n measurement application (requires opt 23) | SW | No |
| Opt. 25 | WLAN 802.11ac measurement application (requires opt 24) | SW | No |
| Opt. 26 | APCO P25 measurement application | SW | No |
| Opt. 27 | Bluetooth Basic LE Tx Measurements | SW | No |
| Opt. 28 | LTE Downlink RF measurements | SW | No |
| Opt. 5GNR | 5G NR Uplink/Downlink RF Power, Bandwidth, Demodulation, and Error Vector Magnitude measurements33 | SW | No |
| Opt. 31 | Bluetooth 5 Measurements (requires opt 27) | SW | No |
| Opt. 32 | EMC pre-compliance and troubleshooting | SW | No |
| Opt. MAP | Mapping and signal strength | SW | No |
| Opt. B40 | 40 MHz Acquisition Bandwidth (from 25 MHz BW) | SW | No |
| Opt. B85 | 85 MHz Acquisition Bandwidth (from 25 MHz BW) | HW | Yes |
| Opt. B85E | 85 MHz Acquisition Bandwidth (from 40 MHz BW) | HW | Yes |
| Opt. B16x | 165 MHz Acquisition Bandwidth (from 25 MHz BW) | HW | Yes |
| Opt. B16xE | 165 MHz Acquisition Bandwidth (from 40 MHz BW) | HW | Yes |
| Opt. B16xH | 165 MHz Acquisition Bandwidth (from 85 MHz BW) | SW | No |
| Opt. B125 | 125 MHz acquisition bandwidth (from 25 MHz BW) | HW | Yes |
| Opt. B125E | 125 MHz acquisition bandwidth (from 40 MHz BW) | HW | Yes |
| Opt. B125H | 125 MHz acquisition bandwidth (from 85 MHz BW) | SW | No |
| Opt. B125HD-125 | High dynamic range, 125 MHz acquisition bandwidth (from 125 MHz BW) | HW | Yes |
| Opt. B125HD-25 | High dynamic range, 125 MHz acquisition bandwidth (from 25 MHz BW) | HW | Yes |
| Opt. B125HD-40 | High dynamic range, 125 MHz acquisition bandwidth (from 40 MHz BW) | HW | Yes |
| Opt. B125HD-85 | High dynamic range, 125 MHz acquisition bandwidth (from 85 MHz BW) | HW | No |
| Opt. B16xHD-125 | High dynamic range, 165 MHz acquisition bandwidth (from 125 MHz BW) | HW | No |
| Opt. B16xHD-165 | High dynamic range, 165 MHz acquisition bandwidth (from 165 MHz BW) | HW | No |
| Opt. B16xHD-25 | High dynamic range, 165 MHz acquisition bandwidth (from 25 MHz BW) | HW | Yes |
| Opt. B16xHD-40 | High dynamic range, 165 MHz acquisition bandwidth (from 40 MHz BW) | HW | Yes |
| Opt. B16xHD-85 | High dynamic range, 165 MHz acquisition bandwidth (from 85 MHz BW) | HW | No |
| Opt. B16xK | 165 MHz acquisition bandwidth (from 125 MHz BW) | HW | No |
| Opt. B85HD-25 | High dynamic range, 85 MHz acquisition bandwidth (from 25 MHz BW) | HW | Yes |
| Opt. B85HD-40 | High dynamic range, 85 MHz acquisition bandwidth (from 40 MHz BW) | HW | Yes |
| Opt. B85HD-85 | High dynamic range, 85 MHz acquisition bandwidth (from 85 MHz BW) | HW | No |
| Opt. 300 | High performance real time (requires opt 09) | HW | No |


