
The MDO4000 Mixed Domain Oscilloscope is a unique and powerful multi-domain instrument that can not only capture and measure analog and digital signals vs. time, but can also do the same with RF signals. Not only can it show you the RF spectral changes vs. time and vs. the analog and digital signals, it can also show several RF vs. Time traces. Specifically, it can compute and display RF Amplitude vs. time, RF Phase Deviation vs. time and RF Frequency vs. time. In this post, I’ll share a recent case that will show how to get the most out of the RF Frequency vs. time trace.
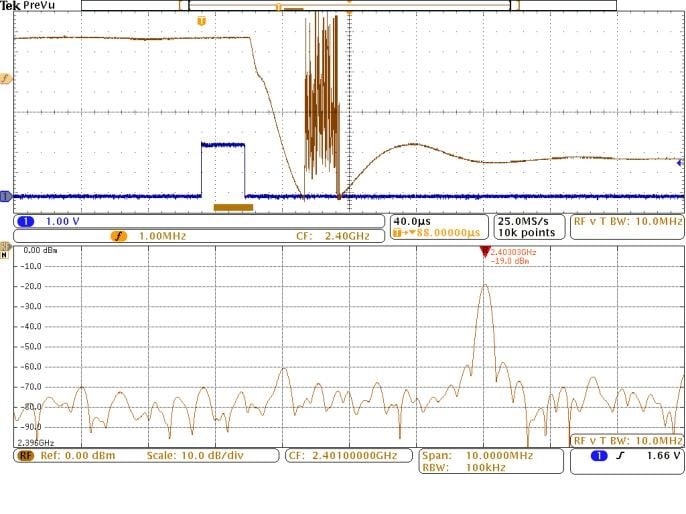
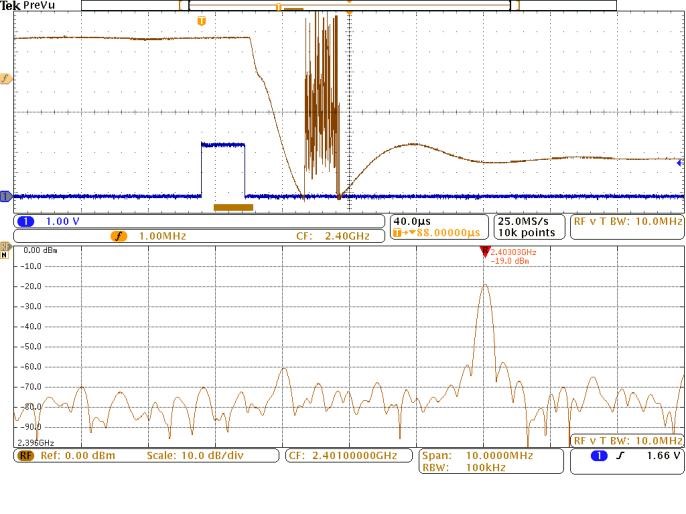
One of our customers recently raised some concerns about the measurements he was making on his synthesizer. While trying to measure the frequency switching time of his device, he was observing a burst of noise in his measurement and was unsure whether his device was becoming unstable or if the scope was misbehaving. His results resembled the following:

The upper part of the display shows one of his control signals (blue trace on Ch1), which is also the source that was used to trigger the acquisition. The other trace is the RF Frequency Deviation vs. Time trace which shows the RF frequency being moved down by about 6MHz. During the frequency transition, a burst of noise is shown on the trace (near the middle of the display). The question was – is this noise indicating that the device is becoming unstable, or is it a problem with the oscilloscope? The answer is – neither.
In order to understand what’s happening, it helps to understand a little about the RF processing in the MDO. When the RF signal is acquired, the samples are converted to baseband IQ samples. The baseband frequency is determined by the Center Frequency setting of the Spectrum Analyzer, and the bandwidth of the IQ samples is determined by the Span setting. The RF Frequency vs. Time trace is computed by taking the first derivative of the phase (arctan(Q/I)) of the IQ vs. time.
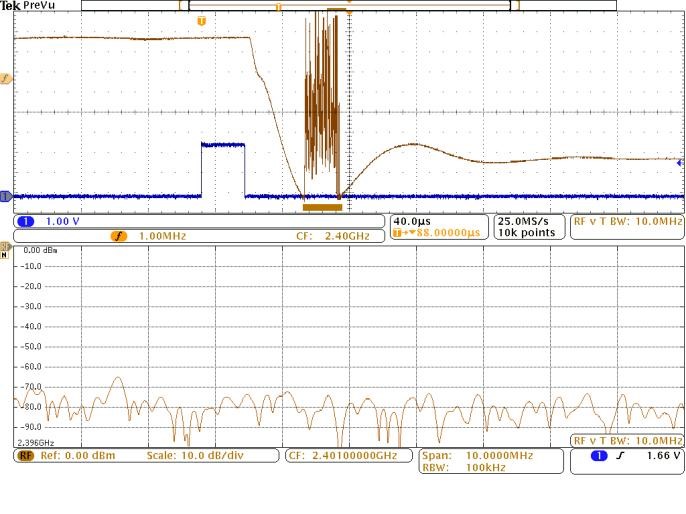
In this case, the MDO is set up with a 2.401GHz center frequency and a span of 10MHz. The frequency of the signal undershoots the final resting frequency by a few MHz during the switching period. The undershoot brings the frequency outside of the span of the spectrum analyzer, and thus outside of the bandwidth of the captured IQ samples. Therefore, for this short period of time, the IQ samples consist only of low level noise with no signal content. Thus the phase computation (arctan(Q/I)) is going to be random noise, as well as the first derivative which is Frequency vs. Time. So, the noise burst is there simply because the RF signal momentarily exited the acquired RF bandwidth. This can be seen in the following picture where the spectrum time is adjusted to the “noisy” section of the Frequency vs. Time, and the resulting spectrum is void of any signal:

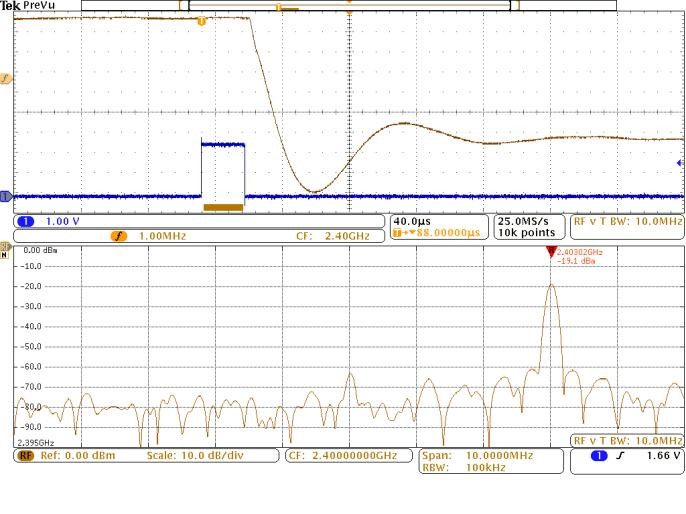
There are several ways to fix this. The MDO4000 features an RF acquisition bandwidth of 1GHz or more, so you could simply increase the span on the spectrum analyzer, which would then increase the bandwidth of the IQ samples. Alternatively, the center frequency could be altered slightly so that the entire excursion of the RF signal frequency is contained within the 10MHz span that is already set up. In the following screen image, the center frequency is adjusted down to 2.400GHz, thereby moving the baseband frequency enough so that the lowest frequency excursion is contained within the capture IQ bandwidth:

As you can see, the “noise” is gone, and the complete frequency transition including the undershoot is clearly visible and measurable.
The MDO4000 is a very powerful tool for analyzing the time domain nature of RF signals with respect to the other analog and digital signals within a system. It is important to understand how each of these signals are processed and displayed in order to get the most out of what this unique tool has to offer. More information, videos, application notes, etc. can be found on the MDO4000 web page.


