
To best understand what an oscilloscope is and how it works, it’s important to note that there are two primary types of oscilloscopes: analog and digital. Analog and digital oscilloscopes have some basic controls that are similar, and some that are different. We’ll look at the basic systems and controls that are common to both. Understanding these systems and controls is key to using an oscilloscope to tackle your specific measurement challenges. Note that your oscilloscope probably has additional controls not discussed here.
The Three Systems
A basic oscope consists of three different systems – the vertical system, horizontal system, and trigger system. Each system contributes to the oscilloscope’s ability to accurately reconstruct a signal.
The front panel of an oscilloscope is divided into three sections labeled Vertical, Horizontal, and Trigger. Your oscilloscope may have other sections, depending on the model and type.
When using an oscilloscope, you adjust settings in these areas to accommodate an incoming signal:
- Vertical: This is the attenuation or amplification of the signal. Use the volts/div control to adjust the amplitude of the signal to the desired measurement range.
- Horizontal: This is the time base. Use the sec/div control to set the amount of time per division represented horizontally across the screen.
- Trigger: This is the triggering of the oscilloscope. Use the trigger level to stabilize a repeating signal, or to trigger on a single event.
We’ll look at each of these systems and controls, in this chapter.

Figure 20: Front-panel control section of an oscilloscope.
Vertical System and Controls
Vertical controls are used to position and scale the waveform vertically, set the input coupling, and adjust other signal conditioning. Common vertical controls include:
- Position
- Coupling: DC, AC, and GND
- Bandwidth: Limit and Enhancement
- Termination: 1M ohm and 50 ohm
- Offset
- Invert: On/Off
- Scale: Fixed Steps and Variable
Some of these controls are described next.
Position and Volts per Division
The vertical position control allows you to move the waveform up and down so it’s exactly where you want it on the screen.
The volts-per-division setting (usually written as volts/div) is a scaling factor that varies the size of the waveform on the screen. If the volts/div setting is 5 volts, then each of the eight vertical divisions represents 5 volts and the entire screen can display 40 volts from bottom to top, assuming a graticule with eight major divisions. If the setting is 0.5 volts/div, the screen can display 4 volts from bottom to top, and so on.
The maximum voltage you can display on the screen is the volts/div setting multiplied by the number of vertical divisions. Note that the probe you use, 1X or 10X, also influences the scale factor.
You must divide the volts/div scale by the attenuation factor of the probe if the oscilloscope does not do it for you. Often the volts/div scale has either a variable gain or a fine gain control for scaling a displayed signal to a certain number of divisions. Use this control to assist in taking rise time measurements.
Input Coupling
Coupling refers to the method used to connect an electrical signal from one circuit to another. In this case, the input coupling is the connection from your test circuit to the oscilloscope.
The coupling can be set to DC, AC, or ground. DC coupling shows all of an input signal. AC coupling blocks the DC component of a signal so that you see the waveform centered around zero volts. Figure 21 illustrates this difference.
The AC coupling setting is useful when the entire signal (alternating current + direct current) is too large for the volts/div setting.

Figure 21: AC and DC input coupling.
The ground setting disconnects the input signal from the vertical system, which lets you see where zero volts is located on the screen.
With grounded input coupling and auto trigger mode, you see a horizontal line on the screen that represents zero volts. Switching from DC to ground and back again is a handy way of measuring signal voltage levels with respect to ground.
Bandwidth Limit
Most oscilloscopes have a circuit that limits the bandwidth of the oscilloscope. By limiting the bandwidth, you reduce the noise that sometimes appears on the displayed waveform, resulting in a cleaner signal display.
Note that while eliminating noise, the bandwidth limit can also reduce or eliminate high frequency signal content.
Bandwidth Enhancement
Some oscilloscopes may provide a DSP arbitrary equalization filter that can be used to improve the oscilloscope channel response. This filter extends the bandwidth, flattens the oscilloscope channel frequency response, improves phase linearity, and provides a better match between channels. It also decreases rise time and improves the time domain step response.
Horizontal System and Controls
An oscilloscope’s horizontal system is most closely associated with its acquisition of an input signal. Sample rate and record length are among the considerations here. Horizontal controls are used to position and scale the waveform horizontally. Common horizontal controls include:
- Acquisition
- Sample Rate
- Position and Seconds per Division
- Time Base
- Zoom/Pan
- Search
- XY Mode
- Z Axis
- XYZ Mode
- Trigger Position
- Scale
- Trace Separation
- Record Length
- Resolution
Some of these controls are described next.
Acquisition Controls
Digital oscilloscopes have settings that let you control how the acquisition system processes a signal. Figure 22 shows an example of an acquisition menu.
Look over the acquisition options on your digital oscilloscope while you read this section.

Figure 22: Example of an acquisition menu.
Acquisition Modes
Acquisition modes control how waveform points are produced from sample points. Sample points are the digital values derived directly from the analog-to-digital converter (ADC). The sample interval refers to the time between these sample points.
Waveform points are the digital values that are stored in memory and displayed to construct the waveform. The time-value difference between waveform points is referred to as the waveform interval.
The sample interval and the waveform interval may or may not be the same. This fact leads to the existence of several different acquisition modes in which one waveform point is comprised of several sequentially acquired sample points.
Additionally, waveform points can be created from a composite of sample points taken from multiple acquisitions, which provides another set of acquisition modes. A description of the most commonly used acquisition modes follows.
Sample Mode: This is the simplest acquisition mode. The oscilloscope creates a waveform point by saving one sample point during each waveform interval.
Peak Detect Mode: The oscilloscope saves the minimum and maximum value sample points taken during two waveform intervals and uses these samples as the two corresponding waveform points.
Digital oscilloscopes with peak detect mode run the ADC at a fast sample rate, even at very slow time base settings (slow time base settings translate into long waveform intervals) and are able to capture fast signal changes that would occur between the waveform points if in sample mode (Figure 23).

Figure 23: Sample rate varies with time base settings - the slower the time based setting, the slower the sample rate. Some digital oscilloscopes provide peak detect mode to capture fast transients at slow sweep speeds.
Peak detect mode is particularly useful for seeing narrow pulses spaced far apart in time, as shown in Figure 24.
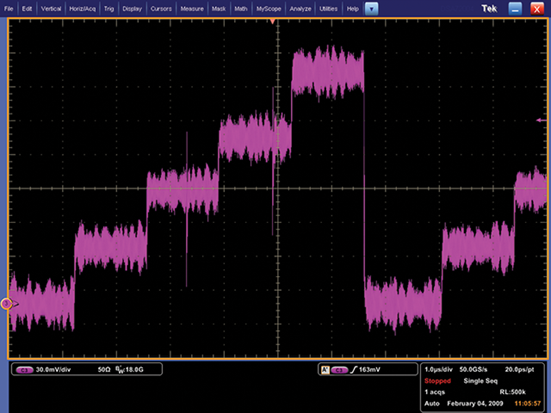
Figure 24: Advanced analysis and productivity software, such as MATLAB®, can be installed in Windows-based oscilloscopes to accomplish local signal analysis.
Hi-Res Mode: Like peak detect, hi-res mode is a way of getting more information in cases when the ADC can sample faster than the time base setting requires. In this case, multiple samples taken within one waveform interval are averaged together to produce one waveform point.
The result is a decrease in noise and an improvement in resolution for low-speed signals. The advantage of Hi-Res Mode over Average is that Hi-Res Mode can be used even on a single shot event.
Envelope Mode: Envelope mode is similar to peak detect mode. However, in envelope mode, the minimum and maximum waveform points from multiple acquisitions are combined to form a waveform that shows min/max accumulation over time.
Peak detect mode is usually used to acquire the records that are combined to form the envelope waveform.
Average Mode: In average mode, the oscilloscope saves one sample point during each waveform interval as in sample mode. However, waveform points from consecutive acquisitions are then averaged together to produce the final displayed waveform.
Average mode reduces noise without loss of bandwidth, but requires a repeating signal.
Waveform Database Mode: In waveform database mode, the oscilloscope accumulates a waveform database that provides a three-dimensional array of amplitude, time, and counts.
Starting and Stopping the Acquisition System
One of the greatest advantages of digital oscilloscopes is their ability to store waveforms for later viewing.
To this end, there are usually one or more buttons on the front panel that allow you to start and stop the acquisition system so you can analyze waveforms at your leisure.
Additionally, you may want the oscilloscope to automatically stop acquiring after one acquisition is complete or after one set of records has been turned into an envelope or average waveform.
This feature is commonly called single sweep or single sequence and its controls are usually found either with the other acquisition controls or with the trigger controls.
Sampling
Sampling is the process of converting a portion of an input signal into a number of discrete electrical values for the purpose of storage, processing, and/or display. The magnitude of each sampled point is equal to the amplitude of the input signal at the instant in time in which the signal is sampled.
Sampling is like taking snapshots. Each snapshot corresponds to a specific point in time on the waveform. These snapshots can then be arranged in the appropriate order in time to reconstruct the input signal.
In a digital oscilloscope, an array of sampled points is reconstructed on a display with the measured amplitude on the vertical axis and time on the horizontal axis (Figure 25).
The input waveform in Figure 25 appears as a series of dots on the screen. If the dots are widely spaced and difficult to interpret as a waveform, the dots can be connected using a process called interpolation.
Interpolation connects the dots with lines or vectors. A number of interpolation methods are available that can be used to produce an accurate representation of a continuous input signal.
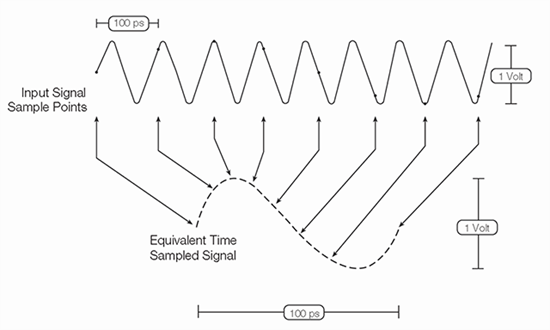
Figure 25: Basic sampling, showing sample points are connected by interpolation to produce a continuous waveform.
Sampling Controls
Some digital oscilloscopes provide you with a choice in sampling method, either real-time sampling or equivalent time sampling. The acquisition controls available with these oscilloscopes allow you to select a sample method to acquire signals.
Note that this choice makes no difference for slow time base settings and only has an effect when the ADC cannot sample fast enough to fill the record with waveform points in one pass. Each sampling method has distinct advantages, depending on the kind of measurements being made.
Controls are typically available to give you the choice of three horizontal time base modes of operations. If you are simply doing signal exploration and want to interact with a lively signal, you use the Automatic or Interactive Default mode that provides you with the liveliest display update rate.
If you want a precise measurement and the highest real-time sample rate that will give you the most measurement accuracy, then you use the Constant Sample Rate mode. It maintains the highest sample rate and provides the best real-time resolution.
The last mode is called the Manual mode because it ensures direct and independent control of the sample rate and record length.
Real-time Sampling Method
Real-time sampling is ideal for signals whose frequency range is less than half the oscilloscope’s maximum sample rate.
Here, the oscilloscope can acquire more than enough points in one “sweep” of the waveform to construct an accurate picture, as shown in Figure 26. Real-time sampling is the only way to capture fast, single-shot, transient signals with a digital oscilloscope.

Figure 26: Advanced analysis and productivity software, such as MATLAB®, can be installed in Windows-based oscilloscopes to accomplish local signal analysis.
Real-time sampling presents the greatest challenge for digital oscilloscopes because of the sample rate needed to accurately digitize high-frequency transient events, as shown in Figure 27.
These events occur only once, and must be sampled in the same time frame that they occur.
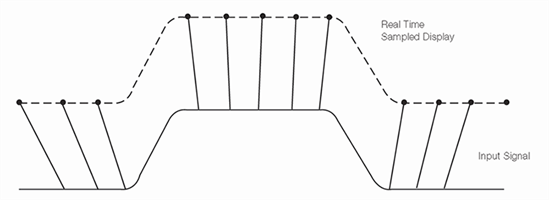
Figure 27: Real-time sampling method.
If the sample rate isn’t fast enough, high-frequency components can “fold down” into a lower frequency, causing aliasing in the display, as demonstrated in Figure 28. In addition, real-time sampling is further complicated by the high-speed memory required to store the waveform once it is digitized.
Please refer to the Sample Rate and Record Length sections in Chapter 3—Evaluating Oscilloscopes for additional detail about the sample rate and record length needed to accurately characterize high-frequency components.
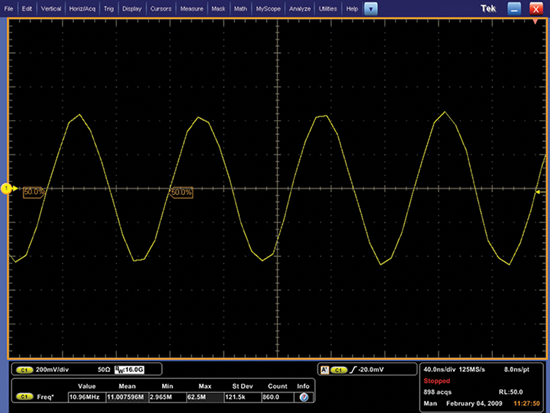
Figure 28: Undersampling of a 100 MHz sine wave introduces aliasing effects.
For real-time sampling with interpolation, digital oscilloscopes take discrete samples of the signal that can be displayed. However, it can be difficult to visualize the signal represented as dots, especially because there can be only a few dots representing high-frequency portions of the signal.
To aid in the visualization of signals, digital oscilloscopes typically have interpolation display modes.
Interpolation is a processing technique used to estimate what the waveform looks like based on a few points. In simple terms, interpolation “connects the dots” so that a signal that is sampled only a few times in each cycle can be accurately displayed.
Using real-time sampling with interpolation, the oscilloscope collects a few sample points of the signal in a single pass in real-time mode and uses interpolation to fill in the gaps. Linear interpolation connects sample points with straight lines. This approach is limited to reconstructing straight- edged signals (Figure 29), which better lends itself to square waves. The more versatile sin x/x interpolation connects sample points with curves (Figure 29).
Sin x/x interpolation is a mathematical process in which points are calculated to fill in the time between the real samples. This form of interpolation lends itself to curved and irregular signal shapes, which are far more common in the real world than pure square waves and pulses. Because of this, sin x/x interpolation is the preferred method for applications where the sample rate is three to five times the system bandwidth.
If the sample rate isn’t fast enough, high-frequency components can “fold down” into a lower frequency, causing aliasing in the display, as demonstrated in Figure 28. In addition, real-time sampling is further complicated by the high-speed memory required to store the waveform once it is digitized.
Please refer to the Sample Rate and Record Length sections in Chapter 3—Evaluating Oscilloscopes for additional detail about the sample rate and record length needed to accurately characterize high-frequency components.
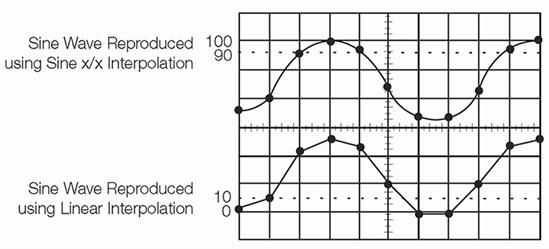
Figure 29: Linear and sin x/x interpolation.
Equivalent-time Sampling Method
When measuring high-frequency signals, the oscilloscope may not be able to collect enough samples in one sweep. Equivalent-time sampling can be used to accurately acquire signals whose frequency exceeds half the oscilloscope’s sample rate (Figure 30).
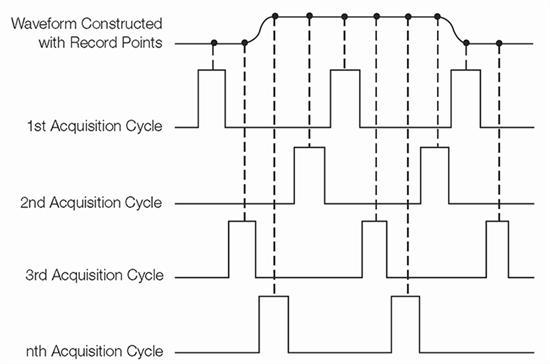
Figure 30: Some oscilloscopes use equivalent-time sampling to capture and display very fast, repetitive signals.
Equivalent-time digitizers (samplers) take advantage of the fact that most naturally occurring and man-made events are repetitive. Equivalent-time sampling constructs a picture of a repetitive signal by capturing a little bit of information from each repetition.
The waveform slowly builds up like a string of lights, illuminating one-by-one. This allows the oscilloscope to accurately capture signals whose frequency components are much higher than the oscilloscope’s sample rate. There are two types of equivalent-time sampling methods: random and sequential. Each has its advantages:
- Random equivalent-time sampling allows display of the input signal prior to the trigger point, without the use of a delay line.
- Sequential equivalent-time sampling provides much greater time resolution and accuracy.
Both require that the input signal be repetitive.
Random Equivalent-time Sampling
Random equivalent-time digitizers (samplers) use an internal clock that runs asynchronously with respect to the input signal and the signal trigger (Figure 31).
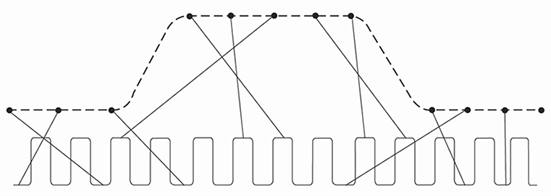
Figure 31: In random equivalent-time sampling, the sampling clock runs asynchronously with the input signal and the trigger.
Samples are taken continuously, independent of the trigger position, and are displayed based on the time difference between the sample and the trigger. Although samples are taken sequentially in time, they are random with respect to the trigger, hence the name “random” equivalent-time sampling. Sample points appear randomly along the waveform when displayed on the oscilloscope screen.
The ability to acquire and display samples prior to the trigger point is the key advantage of this sampling technique, eliminating the need for external pre-trigger signals or delay lines.
Depending on the sample rate and the time window of the display, random sampling may also allow more than one sample to be acquired per triggered event. However, at faster sweep speeds, the acquisition window narrows until the digitizer cannot sample on every trigger.
It is at these faster sweep speeds that very precise timing measurements are often made, and where the extraordinary time resolution of the sequential equivalent-time sampler is most beneficial. The bandwidth limit for random equivalent-time sampling is less than that for sequential-time sampling.
Sequential Equivalent-time Sampling
The sequential equivalent-time sampler acquires one sample per trigger, independent of the time/div setting, or sweep speed, as shown in Figure 32.
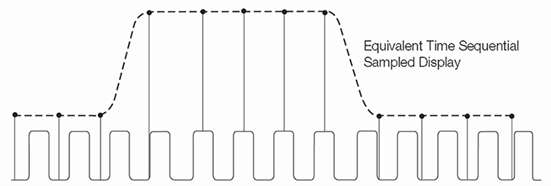
Figure 32: In sequential equivalent-time sampling, the single sample is taken for each recognized trigger after a time delay which is incremented after each cycle.
When a trigger is detected, a sample is taken after a very short, but well-defined, delay. When the next trigger occurs, a small time increment—delta t—is added to this delay and the digitizer takes another sample.
This process is repeated many times, with “delta t” added to each previous acquisition, until the time window is filled. Sample points appear from left to right in sequence along the waveform when displayed on the oscilloscope screen.
Technologically speaking, it is easier to generate a very short, very precise “delta t” than it is to accurately measure the vertical and horizontal positions of a sample relative to the trigger point, as required by random samplers. This precisely measured delay is what gives sequential samplers their unmatched time resolution.
With sequential sampling, the sample is taken after the trigger level is detected, so the trigger point cannot be displayed without an analog delay line. This may, in turn, reduce the bandwidth of the instrument. If an external pretrigger can be supplied, bandwidth will not be affected.
Position and Seconds per Division
The horizontal position control moves the waveform left and right to exactly where you want it on the screen. The seconds-per-division setting (usually written as sec/div) lets you select the rate at which the waveform is drawn across the screen (also known as the time base setting or sweep speed).
This setting is a scale factor. If the setting is 1 ms, each horizontal division represents 1 ms and the total screen width represents 10 ms, or ten divisions. Changing the sec/div setting enables you to look at longer and shorter time intervals of the input signal.
As with the vertical volts/div scale, the horizontal sec/div scale may have variable timing, allowing you to set the horizontal time scale between the discrete settings.
Time Base Selections
Your oscilloscope has a time base, which is usually referred to as the main time base. Many oscilloscopes also have what is called a delayed time base. This is a time base with a sweep that can start (or be triggered to start) relative to a pre-determined time on the main time base sweep.
Using a delayed time base sweep allows you to see events more clearly and to see events that are not visible solely with the main time base sweep.
The delayed time base requires the setting of a time delay and the possible use of delayed trigger modes and other settings not described in this primer. Refer to the manual supplied with your oscilloscope for information on how to use these features.
Zoom/Pan
Your oscilloscope may have special horizontal magnification settings that let you display a magnified section of the waveform on-screen. Some oscilloscopes add pan functions to the zoom capability. Knobs are used to adjust zoom factor or scale and the pan of the zoom box across the waveform.
Search
Some oscilloscopes offer search and mark capabilities, enabling you to quickly navigate through long acquisitions looking for user-defined events.
XY Mode
Most oscilloscopes have an XY mode that lets you display an input signal, rather than the time base, on the horizontal axis. This mode of operation opens up a whole new area of phase shift measurement techniques, as explained in the Oscilloscope Measurement Techniques section of Chapter 5—Setting Up and Using an Oscilloscope.
Z Axis
A digital phosphor oscilloscope (DPO) has a high display sample density and an innate ability to capture intensity information. With its intensity axis (Z-axis), the DPO is able to provide a three-dimensional, real-time display similar to that of an analog oscilloscope.
As you look at the waveform trace on a DPO, you can see brightened areas. These are the areas where a signal occurs most often.
This display makes it easy to distinguish the basic signal shape from a transient that occurs only once in a while—the basic signal appears much brighter. One application of the Z-axis is to feed special timed signals into the separate Z input to create highlighted “marker” dots at known intervals in the waveform.
XYZ Mode with DPO and XYZ Record Display
Some DPOs can use the Z input to create an XY display with intensity grading. In this case, the DPO samples the instantaneous data value at the Z input and uses that value to qualify a specific part of the waveform.
Once you have qualified samples, these samples can accumulate, resulting in an intensity-graded XYZ display.
XYZ mode is especially useful for displaying the polar patterns commonly used in testing wireless communication devices, such as a constellation diagram.
Another method of displaying XYZ data is XYZ record display. In this mode the data from the acquisition memory is used rather than the DPO database.
Trigger System and Controls
An oscilloscope’s trigger function synchronizes the horizontal sweep at the correct point of the signal. This is essential for clear signal characterization. Trigger controls allow you to stabilize repetitive waveforms and capture single-shot waveforms.
The trigger makes repetitive waveforms appear static on the oscilloscope display by repeatedly displaying the same portion of the input signal. Imagine the jumble on the screen that would result if each sweep started at a different place on the signal, as illustrated in Figure 33.
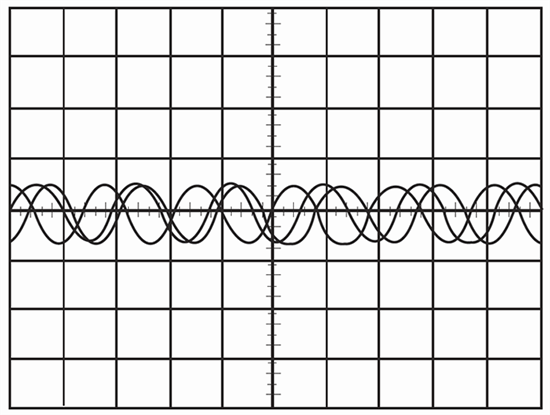
Figure 33: Untriggered display.
Edge triggering, available in analog and digital oscilloscopes, is the basic and most common type. In addition to threshold triggering offered by both analog and digital oscilloscopes, many digital oscilloscopes offer numerous specialized trigger settings not offered by analog instruments.
These triggers respond to specific conditions in the incoming signal, making it easy to detect, for example, a pulse that is narrower than it should be. Such a condition is impossible to detect with a voltage threshold trigger alone.
Advanced trigger controls enable you to isolate specific events of interest to optimize the oscilloscope’s sample rate and record length. Advanced triggering capabilities in some oscilloscopes give you highly selective control.
You can trigger on pulses defined by amplitude (such as runt pulses), qualified by time (pulse width, glitch, slew rate, setup-and-hold, and time-out), and delineated by logic state or pattern (logic triggering).
Other advanced trigger functions include:
Pattern Lock Triggering: Pattern lock triggering adds a new dimension to NRZ serial pattern triggering by enabling the oscilloscope to take synchronized acquisitions of a long serial test pattern with outstanding time base accuracy.
Pattern lock triggering can be used to remove random jitter from long serial data patterns. Effects of specific bit transitions can be investigated, and averaging can be used with mask testing.
Serial Pattern Triggering: Serial pattern triggering can be used to debug serial architectures. It provides a trigger on the serial pattern of an NRZ serial data stream with built-in clock recovery and correlates events across the physical and link layer.
The instrument can recover the clock signal, identify transitions, and allow you to set the desired encoded words for the serial pattern trigger to capture.
A & B Triggering: Some trigger systems offer multiple trigger types only on a single event (A event), with delayed trigger (B event) selection limited to edge type triggering and often do not provide a way to reset the trigger sequence if the B event doesn’t occur.
Modern oscilloscopes can provide the full suite of advanced trigger types on both A and B triggers, logic qualification to control when to look for these events, and reset triggering to begin the trigger sequence again after a specified time, state, or transition so that even events in the most complex signals can be captured.
Search & Mark Triggering: Hardware triggers watch for one event type at a time, but Search can scan for multiple event types simultaneously. For example, scan for setup or hold time violations on multiple channels. Individual marks can be placed by Search indicating events that meet search criteria.
Trigger Correction: Since the trigger and data acquisition systems share different paths there is some inherent time delay between the trigger position and the data acquired. This results in skew and trigger jitter.
With a trigger correction system the instrument adjusts the trigger position and compensates for the difference of delay there is between the trigger path and the data acquisition path. This eliminates virtually any trigger jitter at the trigger point. In this mode, the trigger point can be used as a measurement reference. Serial Triggering on Specific Standard Signals I2C, CAN, LIN, etc.):
Some oscilloscopes (compare Tektronix oscilloscopes) provide the ability to trigger on specific signal types for standard serial data signals such as CAN, LIN, I2C, SPI, and others. The decoding of these signal types is also available on many oscilloscopes.
Parallel Bus Triggering: Multiple parallel buses can be defined and displayed at one time to easily view decoded parallel bus data over time. By specifying which channels are the clock and data lines, you can create a parallel bus display on some oscilloscopes that automatically decodes bus content.
You can save countless hours by using parallel bus triggers to simplify capture and analysis. Optional trigger controls in some oscilloscopes are designed specifically to examine communications signals as well.
Figure 34 highlights a few of these common trigger types in more detail. To maximize your productivity, some oscilloscopes provide an intuitive user interface to allow rapid setup of trigger parameters with wide flexibility in the test setup.
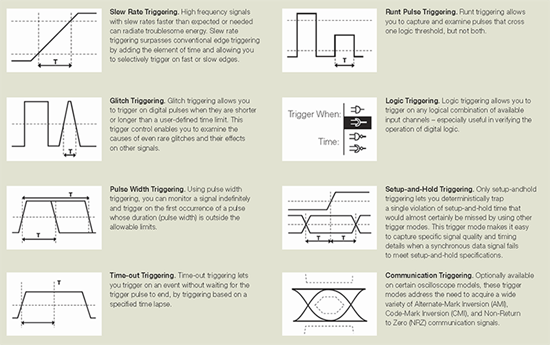
Figure 34: Common trigger types.
Trigger Position
Horizontal trigger position control is only available on digital oscilloscopes. The trigger position control may be located in the horizontal control section of your oscilloscope. It actually represents the horizontal position of the trigger in the waveform record.
Varying the horizontal trigger position allows you to capture what a signal did before a trigger event, known as pre-trigger viewing. Thus, it determines the length of viewable signal both preceding and following a trigger point.
Digital oscilloscopes can provide pre-trigger viewing because they constantly process the input signal, whether or not a trigger has been received. A steady stream of data flows through the oscilloscope; the trigger merely tells the oscilloscope to save the present data in memory.
In contrast, analog oscilloscopes only display the signal—that is, write it on the CRT—after receiving the trigger. Thus, pre-trigger viewing is not available in analog oscilloscopes, with the exception of a small amount of pre-trigger provided by a delay line in the vertical system.
Pre-trigger viewing is a valuable troubleshooting aid. If a problem occurs intermittently, you can trigger on the problem, record the events that led up to it and, possibly, find the cause.
Trigger Level and Slope
The trigger level and slope controls provide the basic trigger point definition and determine how a waveform is displayed (Figure 35).
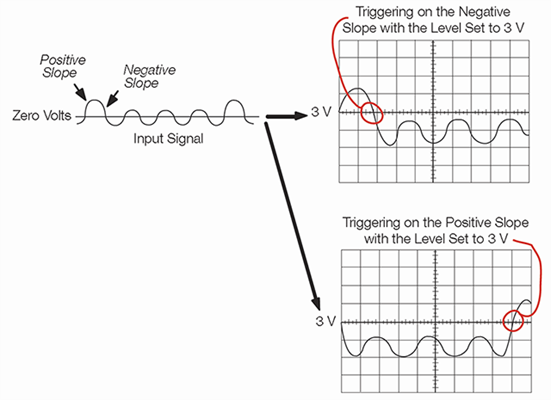
Figure 35: Positive and negative slope triggering.
The trigger circuit acts as a comparator. You select the slope and voltage level on one input of the comparator. When the trigger signal on the other comparator input matches your settings, the oscilloscope generates a trigger.
The slope control determines whether the trigger point is on the rising or the falling edge of a signal. A rising edge is a positive slope and a falling edge is a negative slope. The level control determines where on the edge the trigger point occurs.
Trigger Sources
The oscilloscope does not necessarily need to trigger on the signal being displayed. Several sources can trigger the sweep:
- Any input channel
- An external source other than the signal applied to an input channel
- The power source signal
- A signal internally defined by the oscilloscope, from one or more input channels
Most of the time, you can leave the oscilloscope set to trigger on the channel displayed. Some oscilloscopes provide a trigger output that delivers the trigger signal to another instrument.
The oscilloscope can use an alternate trigger source, whether or not it is displayed, so you should be careful not to unwittingly trigger on channel 1 while displaying channel 2, for example.
Trigger Modes
The trigger mode determines whether or not the oscilloscope draws a waveform based on a signal condition. Common trigger modes include normal and auto:
- In normal mode the oscilloscope only sweeps if the input signal reaches the set trigger point. Otherwise, the screen is blank (on an analog oscilloscope) or frozen (on a digital oscilloscope) on the last acquired waveform. Normal mode can be disorienting since you may not see the signal at first if the level control is not adjusted correctly.
- Auto mode causes the oscilloscope to sweep, even without a trigger. If no signal is present, a timer in the oscilloscope triggers the sweep. This ensures that the display will not disappear if the signal does not cause a trigger.
In practice, you will probably use both modes: normal mode because it lets you see just the signal of interest, even when triggers occur at a slow rate, and auto mode because it requires less adjustment. Many oscilloscopes also include special modes for single sweeps, triggering on video signals, or automatically setting the trigger level.
Trigger Coupling
Just as you can select either AC or DC coupling for the vertical system, you can choose the kind of coupling for the trigger signal.
Besides AC and DC coupling, your oscilloscope may also have high frequency rejection, low frequency rejection, and noise rejection trigger coupling. These special settings are useful for eliminating noise from the trigger signal to prevent false triggering.
Trigger Holdoff
Sometimes getting an oscilloscope to trigger on the correct part of a signal requires great skill. Many oscilloscopes have special features to make this task easier.
Trigger holdoff is an adjustable period of time after a valid trigger during which the oscilloscope cannot trigger. This feature is useful when you are triggering on complex waveform shapes, so that the oscilloscope only triggers on an eligible trigger point.
Figure 36 shows how using trigger holdoff helps create a usable display.
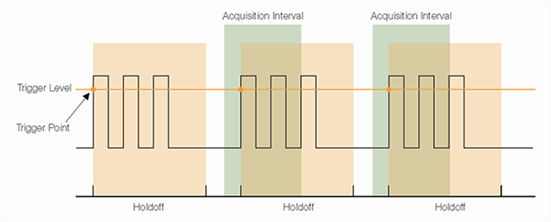
Figure 36: Trigger holdoff helps create a usable display
Controls for Math and Measurement Operations
Your oscilloscope may also have operations that allow you to add waveforms together, creating a new waveform display. Analog oscilloscopes combine the signals while digital oscilloscopes create new waveforms mathematically. Subtracting waveforms is another math operation.
Subtraction with analog oscilloscopes is possible by using the channel invert function on one signal and then using the add operation. Digital oscilloscopes typically have a subtraction operation available. Figure 38 illustrates a third waveform created by combining two different signals.
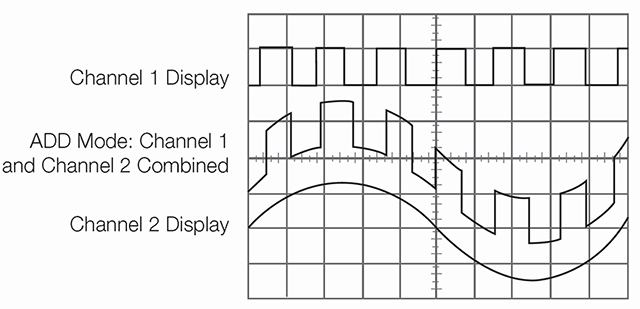
Figure 38: Adding channels.
Using the power of their internal processors, digital oscilloscopes offer many advanced math operations: multiplication, division, integration, Fast Fourier Transform, and more.
This advanced signal processing capability can also perform functions such as the insertion of a filter block that can be used to de-embed the characteristics of the fixture on the device under test or implement a filter block with desired frequency response such as a low pass filter.
The processing block is flexible, not dedicated. It can perform as an arbitrary filter instead. For example, for simulation of pre-emphasis/de-emphasis schemes.
Digital Timing and State Acquisitions
Digital channels provided by a mixed signal oscilloscope enable acquisition capabilities similar to those found on logic analyzers. There are two major digital acquisition techniques:
- With timing acquisition, the MSO samples the digital signal at uniformly spaced times determined by the MSO's sample rate. At each sample point, the MSO stores the signal's logic state and creates a timing diagram of the signal.
- State acquisition defines special times that the digital signal's logic state is valid and stable. This is common in synchronous and clocked digital circuits. A clock signal defines the time when the signal state is valid. For example, the input signal stable time is around the rising clock edge for a D-Flip-Flop with rising edge clocking. The output signal stable time is around the falling clock edge for a D-Flip-Flop with rising edge clocking. Since the clock period of a synchronous circuit may not be fixed, the time between state acquisitions may not be uniform as it is in a timing acquisition.
A mixed signal oscilloscope's digital channels acquire signals similar to how a logic analyzer acquires signals in timing acquisition mode.
The MSO then decodes the timing acquisition into a clocked bus display and event table display, which is similar to the logic analyzer's state acquisition. This provides important information during debugging.
Other Controls
This chapter described the basic oscilloscope controls that a beginner needs to know about. Your oscilloscope may have other controls for various functions. Some of these may include:
- Automatic parametric measurements
- Measurement cursors
- Keypads for mathematical operations or data entry
- Printing capabilities
- Interfaces for connecting your oscilloscope to a computer or directly to the Internet
Read your oscilloscope’s manual to find out more about these other controls or continue on to Chapter 05: Setting Up and Using an Oscilloscope. Still looking for the right oscilloscope? Explore the Tektronix offering to find the right oscope for your application.


