Introduction
Phase-locked loops (PLL) are frequently used in communication applications. For example, they recover the clock from digital data signals (CDR), recover the carrier from satellite transmission signals, perform frequency and phase modulation and demodulation, and synthesize exact frequencies for receiver tuning. The PLL characteristics include bandwidth, noise, acquisition range and speed, dynamic range, stability and accuracy. After introducing the operating principles of the PLL, this note describes how to accomplish typical PLL characterization tests using the TDSJIT3 Jitter and Timing Analysis Application running on real-time oscilloscopes.
Operating Principles of the PLL
A PLL is a circuit that synchronizes both the frequency and phase of an output signal (generated by an oscillator) with a reference or input signal. In the synchronized (often called locked) state the phase error between the oscillator's output signal and the reference signal is zero, or remains constant. If a phase error builds up, a control mechanism acts on the oscillator in such a way that the phase error is again reduced to a minimum. In such a feedback control system the phase of the output signal is actually locked to the phase of the reference signal. This is why it is referred to as a phase-locked loop.

The PLL consists of three basic functional blocks: a voltage-controlled oscillator (VCO), a phase detector (PD) and a loop filter (LF) as shown in Figure 1.
The phase detector compares the input signal and the VCO output signal. The difference is filtered by the loop filter before it has been used to adjust the VCO. Since the LF is a low pass filter, it only allows the low frequency part of the phase difference to pass to the VCO. The high frequency part is filtered out. As a result, the PLL only tracks the low frequency variation and does not follow the high frequency variation.
When a PLL is modeled as a linear system, each block is represented by its transfer function as shown in Figure 2
The input-output system is represented by the closed-loop transfer function. Two types of closedloop transfer function are commonly used. One is the phase transfer function H(s) defined as
| H(s) = | θout(s) |
| θin(s) |
The other is the error-transfer function He(s) defined as
| He(s) = | θe(s) |
| θin(s) |
The phase transfer function H(s) is low-pass, while the error transfer function He(s) is high-pass. The relation between them is
He(s) + H(s) = 1
Note that this equation evaluates complex values. Since complex values have magnitudes and phases, the equation doesn't imply the magnitudes of these two transfer functions add up to 1.
The cutoff frequency of a system is typically defined as the frequency at which the magnitude gain has fallen to –3 dB. It is important to note whether the cutoff frequency is defined based on the phase transfer function or on the error transfer function. For example, if a first-order PLL has a phase transfer
| function | H(s) = | 1 | ,its corresponding error |
| s+1 |
transfer function He(s) = 1 - H(s) has the same cutoff frequency. However, if a second-order PLL has
| a phase transfer function | H(s) = | 1.4s+1 | ,the |
| s2+1.4s+1 |
cutoff frequency of the phase transfer function and the cutoff frequency of the error transfer function are different, as shown in Figure 3.


Jitter Generation and Verification
To characterize a PLL, a test signal with controlled jitter is required. Signal generators can generate such signals, but it is important to verify the rate and deviation of the test signal if the generator's modulation characteristics are unknown or uncalibrated. TDSJIT3 can be used to measure the jitter in the generated signal. The jitter generation measurement is the same as the jitter output measurement.
Jitter is defined as the time deviation from the nominal value. In practice, various types of jitter are used. Among them, period jitter and TIE (time interval error) jitter are commonly used. It is well known that the period jitter is the first-order difference of the TIE jitter, or conversely, that the TIE jitter is the integral of the period jitter since
∆Pn = Pn - P = [(n+1)xP + ∆tn+1] - (n x P + ∆tn) - P = ∆tn+1 - ∆tn
where ∆Pn is the period jitter, Pn is the actual period, P is the nominal period and ∆tn is the TIE jitter.
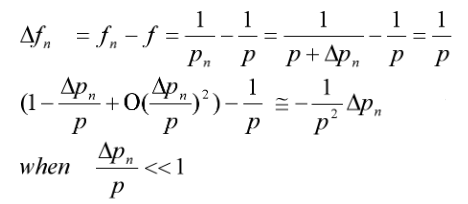
Frequency and phase are related variables. Since a PLL is phase locked-loop, the phase is the natural variable to look at for a PLL. The phase is the integral of the frequency and the frequency is the difference of phase. So the relation between the phase jitter and the frequency jitter is the same as that between the TIE jitter and the period jitter. The period jitter and frequency jitter have the following connection

When the period jitter is relatively small compared to the nominal period, the frequency jitter is proportional to the period jitter. If the period jitter is not small, then

frequency jitter and the period jitter will no longer be proportional to each other.


In the following example, a triangular signal is used for frequency modulation (FM). In Figure 4, a function generator is used to generate triangular signal, which is used as the external modulating input of a signal generator. The RF output is then connected to a Tektronix TDS7404B real-time oscilloscope. TDSJIT3 running on the real-time oscilloscope is used to measure jitter.
Figure 5 shows a plot of the measured frequency vs. time as captured using TDSJIT3. In order to more clearly view the applied modulation, the high frequency noise should be removed. In TDSJIT3, this can be done using Measurements>Configure Meas>Filters and applying an appropriate low pass filter. (For this example a cutoff frequency of 2 MHz was used.) The result is shown in Figure 6.
From Figure 6, it is straightforward to verify both the rate and deviation of the modulating frequency, as well as the center frequency of the modulated carrier


Figure 7 shows that the (low pass filtered) period also has a triangular profile. This is because the modulation is a narrow band FM. The period change is relatively small, so the period jitter is proportional to the frequency jitter.
Note that the TIE jitter is the integral of the period jitter. Integrating a triangular function, as shown in Figure 8, has a shape similar to a sinusoidal function
PLL Jitter Tracking Performance Test
The objective of the jitter tracking performance test is to learn how much jitter a PLL can handle on its input signal while still remaining locked. For any given modulating frequency, the PLL will fall out of lock when the jitter reaches a certain deviation. In this test, TDSJIT3 is used to verify the jitter level being applied to the PLL while the device under test typically provides an indication when it has fallen out of lock, as shown in Figure 9. The role of TDSJIT3 in this test is the same as its role in jitter generation test.
The magnitude and frequency of jitter can be easily measured and viewed using TDSJIT3. The time trend plot provides a clear time domain view as shown in Figure 10, and the spectrum plot gives the frequency domain view shown in Figure 11.


The precise magnitude of the periodic jitter (PJ) component can be obtained by doing Rj-Dj separation as shown in Figure 12. The Rj-Dj separation gives a periodic jitter peak-peak value of 4.7ns, which correlates well with cursor measurements from the time trend plot. The spectrum plot shows the periodic jitter has frequency of 225 KHz, and its RMS value correlates to the peak-peak value measured in time domain.
Jitter Transfer
The jitter transfer test compares the jitter coming out of a PLL with the jitter going into the PLL. The transfer function plot in TDSJIT3 makes it easy to accomplish this task. In TDSJIT3, configure one jitter measurement on the input signal to the PLL, and another equivalent jitter measurement on the output signal from the PLL. Then view the transfer function between these two measurements, conventionally using the output measurement as the numerator of the transfer function.
In the following example, the same FM signal used in the previous jitter tracking test section is used as the input signal. In TDSJIT3, the first measurement is a clock TIE on this FM signal. The second measurement should be a clock TIE on the output signal of a PLL under test with this FM signal as the input signal. Here a clock PLL TIE is selected as the second measurement. This configuration is used to test the software PLL in TDSJIT3. The software PLL is first order and has a cutoff frequency of 2.25 MHz, 10 times of the modulating signal frequency.


To create the transfer function plot in TDSJIT3, go to Plot>Create and select the measurement corresponding to the output signal. Under “Add Plot”, select Transfer Function, and then select the measurement corresponding to the input signal for the denominator of the transfer function.
Figure 14 shows that at the specified PLL cutoff frequency point, the transfer function has a gain of -149.2 m in units of log10. This gain can be converted to decibels (dB) by multiplying by 20. The result,-3dB, confirms the bandwidth of the PLL under test. Note that the transfer function plot uses averaging by default, and that averaging several acquisitions will yield a smoother plot. Figure 15 shows that the periodic jitter at the output of the PLL is attenuated about 10 times compared to the value in Figure 12. This is consistent with the fact that the periodic jitter has a frequency about 10 times lower than the PLL cutoff frequency.


PLL Transient Response
The transient response of a PLL shows how it responds to a step change of frequency. The frequency change may occur due to a step change in the input signal frequency, or a change in a divide ratio within the PLL. The output frequency of the PLL will move from the initial value to the new value through a transient period, as shown in Figure 16.
The following two parameters are commonly used to characterize the transient response:
– Step Time (Td): the time that the PLL takes to nominally reach the correct new frequency after a step change in input frequency
– Settling Time (Ts): the time that the PLL takes to settle to within a specified range ((f2-∆, f2+∆) after a step change in input frequency, where ∆ could be 2% or 5% of |f2-f1|.
This transient response is a step response, so sometimes overshoot value is also used for characterization.
For a linear time-invariant (LTI) system, the step response is the integral of the impulse response h(t). The Fourier transform of the impulse response is the transfer function H(s). So if either the transfer function or step response of a linear PLL is known, the other can be derived. Note that the transfer function H(s) is generally a complex function whereas the transfer function measurement in TDSJIT3 is magnitude-only
The following example demonstrates how to measure the transient response using an oscilloscope and TDSJIT3. In order to capture the transient response, the oscilloscope needs to be triggered by the step signal. TDSJIT3 is used to measure the PLL output frequency. In this example, as shown in Figure 17, a step signal from a function generator is used as the external FM modulating signal to a signal generator. The transient response of the internal PLL in the signal generator is to be measured. The frequency modulated sinusoid signal from the generator is connected to CH1 of a TDS7404B. The step signal is also connected to CH3 for use as a trigger
TDSJIT3 is configured to make a clock frequency measurement on CH1. The time trend plot in Figure 18 shows the step change of the frequency

The large amount of high frequency noise obscures the characteristic of the transient response and should be removed. Low pass filtering can do this. The cutoff frequency of the low pass filter should be low enough to remove the unwanted noise but high enough to avoid affecting the transient response. The rise time of the PLL is correlated to its cutoff frequency. Same principle applies to the low pass filter. The following formula is a rule of thumb for calculating the effect of multiple rise times:

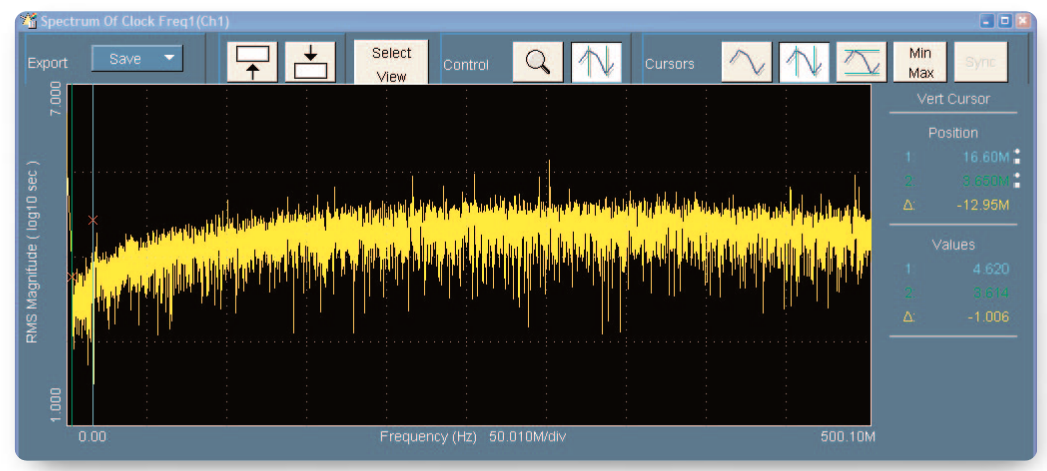
If the cutoff frequency of the PLL is known, then the cutoff frequency of the low pass filter can be set to any value higher than 3 to 5 times of the cutoff frequency of the PLL, so the filter will have no significant effects on the transient response. If the cutoff frequency of the PLL is unknown, an appropriate cutoff frequency for the low pass filter can be determined as follows: first look at the spectrum to identify the range of candidate cutoff frequencies. As shown in Figure 19, the lump at very low frequencies (below 3 MHz) is what needs to be kept; the spectrum beyond 16 MHz is noise that needs to be removed.


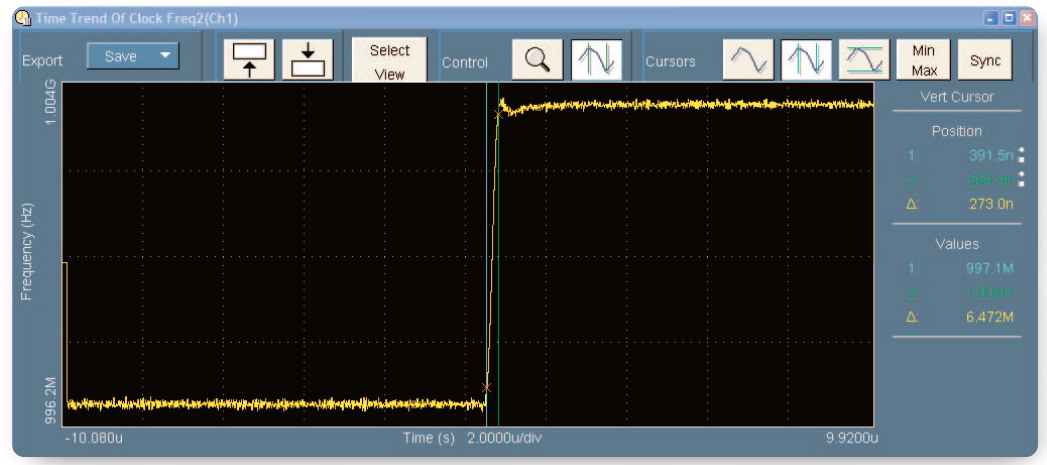
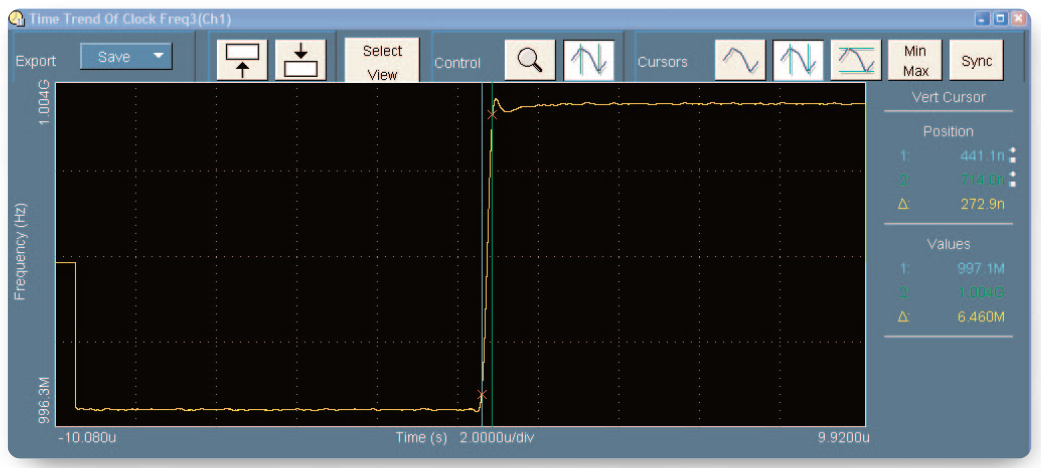
Use several different values from the range determined in the previous step, and check the filtering effects. TDSJIT3 allows multiple instances of the same measurement (for example, clock frequency on CH1) to be created, with a different filter configuration for each of them. In this example, three clock frequency measurements are configured. The first clock frequency measurement is without a filter, as shown in Figure 18. The second and third ones include a low pass filter with cutoff frequency of 16 MHz and 4 MHz respectively, as shown in Figure 20 and 21. The rise times in Figure 20 and 21 measured by cursor are close enough to imply that the filter with 4 MHz cutoff frequency does not distort the transient response, and Figure 21 is clean enough to take measurement of the transient response parameters.

In Figure 22, the plot zoom function has been used to expand the time scale in the area around the transient, to show greater detail. The plot cursors show that the step time Td is 409 ns. They also show that the initial and final frequencies are f1 = 996.7 MHz and f2 =1.004 GHz.Finally, the cursors can be used to measure the frequency overshoot as about 2.5%.
Conclusions
As a general-purpose jitter and timing analysis application, TDSJIT3 is a convenient and powerful tool for analyzing and debugging circuits such as PLLs. It provides accurate measurements and clear plots in the time domain and frequency domain, helping users quickly characterize PLL characteristics such as jitter generation, jitter tolerance, jitter transfer
Find more valuable resources at TEK.COM
Copyright © Tektronix. All rights reserved. Tektronix products are covered by U.S. and foreign patents, issued and pending. Information in this publication supersedes that in all previously published material. Specification and price change privileges reserved. TEKTRONIX and TEK are registered trademarks of Tektronix, Inc. All other trade names referenced are the service marks, trademarks or registered trademarks of their respective companies.
09/04 61W-18193-0

