This Application Note:
• Gives a brief orientation on the physical layer and packet structure of Ethernet, with a goal of providing just enough detail to help with troubleshooting
• Explains how to set up decoding on an oscilloscope equipped with Ethernet decoding
• Explains how to interpret serial bus data on an oscilloscope equipped with Ethernet decoding
• Explains what triggering and searching options are available on an oscilloscope with Ethernet analysis tools
With the optional serial triggering and analysis capability, Tektronix oscilloscopes become power tools for embedded system designers working with Ethernet buses. In this application note, the 5 Series MSO is used to demonstrate Ethernet serial bus decoding and triggering.
Other Tektronix oscilloscopes also support Ethernet triggering and analysis. See “Serial Support Using Oscilloscopesand Optional Software”for a complete listing.
Introduction
Ethernet is a family of frame-based computer networking technologies for local area networks (LANs), initially developed at Xerox PARC in the early 1970s. The first standard draft was published in 1980 by the Institute of Electrical and Electronics Engineers (IEEE). Approval of IEEE 802.3 CSMA/CD occurred in 1982 and the international ISO/IEEE 802.3 standard was approved in 1984.
The popularity of 10BASE-T and 100BASE-TX and decreasing implementation cost have spurred their use in embedded system designs, as well as continuing to be used as a system-level interconnect technology.
Analyzing Ethernet traffic, both at the physical and protocol layers, enables verification of communication between connected systems and can provide insight into the operation of subsystems in an embedded design. However, a single differential Ethernet signal includes address, control, data, and clock information, which can make isolating events of interest difficult. Ethernet Serial Triggering and Analysis options transform select Tektronix oscilloscopes (listed in Appendix A) into robust tools for debugging 10BASE-T and 100BASE-TX-based systems with automatic trigger, decode, and search.
How it Works
Two of the most common versions of Ethernet are 10BASE-T and 100BASE-TX which are found on most personal computers. The leading number represents the data rate in Mb/s. BASE indicates that the signals are baseband signals and there is no RF signal modulation. The T denotes the twisted pair wires that are in the LAN cable that is used between network nodes.
Ethernet provides peer-to-peer packet-based communication, enabling direct point-to-point communication. At the physical layer, the 10BASE-T and 100BASE-TX signals transport address, control, data, and clock information. The data is transferred in sequences of data bytes called packets. Ethernet packets can carry other, higher-level protocol packets inside of them. For example, an Ethernet packet may contain an Internet Protocol (IP) packet, which in turn may contain a Transmission Control Protocol (TCP) packet. This signal complexity makes isolating events of interest difficult when analyzing 10BASE-T and 100BASE-TX waveforms.
The Ethernet data frame format is defined by the IEEE 802.3 standard and contains seven fields:
|
TYPE |
PREAMBLE |
START-OF-FRAME DELIMITER |
DESTINATION ADDRESS |
SOURCE ADDRESS |
LENGTH/TYPE |
DATA + PAD |
FRAME CHECK SEQUENCE |
|
BYTES |
7 |
1 |
6 |
6 |
2 |
46-1500 |
4 |
• The Preamble is seven bytes long consisting of an alternating pattern of ones and zeros for synchronization.
• The Start-of-frame Delimiter is a single byte with alternating ones and zeros but ending in two ones.
• The Destination and Source Media Access Control (MAC) Addresses are each six bytes long, transmitted in most- significant to least-significant bit order. Each Ethernet node is assigned a unique MAC address which is used to specify both the destination and the source of each data packet.
• The Length/Type field is a two-byte value. If the decimal value of Length/Type is ≤1500, it represents the number of data bytes in the data field. If the value of Length/Type is >1536 (0x0600), it is an EtherType value which specifies the protocol that is encapsulated in the payload of the Ethernet frame. (For example, EtherType is set to 0x0800 for IPv4.)
• The Data packet contains 46 to 1500 bytes. If the data is less than 46 bytes long, the data field is padded to be 46 bytes long.
• The Frame Check Sequence is a 32-bit cyclic redundancy check (CRC) and provides error checking across the Destination Address, Source Address, Length/Type and Data fields.
• After each frame has been sent, transmitters are required to transmit a minimum of 12 bytes of idle characters before transmitting the next frame, or they must remain idle for an equal amount of time by de-asserting the transmit enable signal.
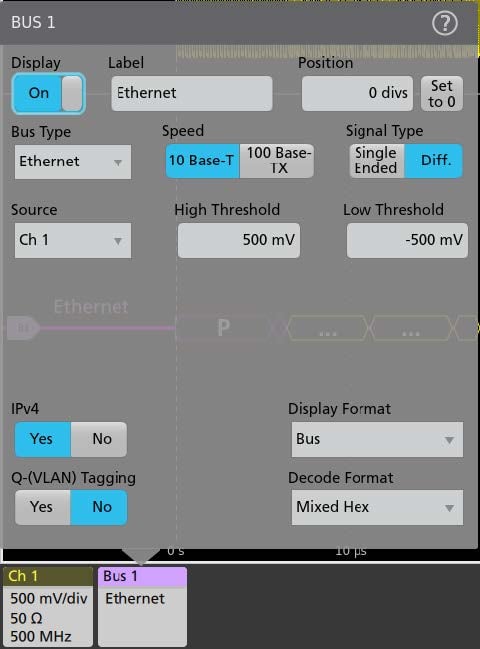
SETTING UP 10BASE-T ETHERNET BUS DECODING
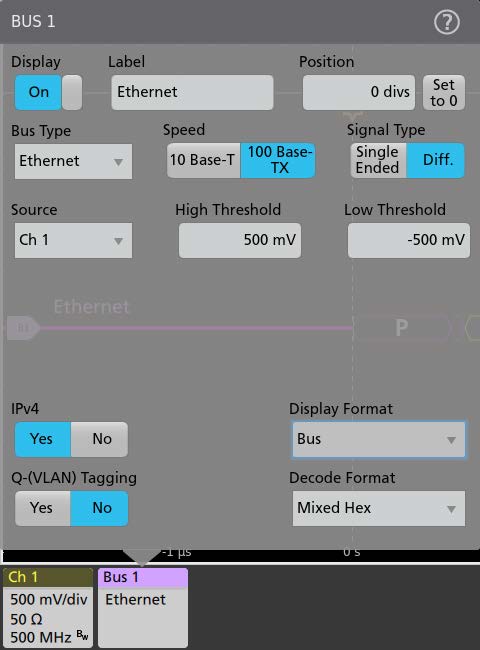
On Tektronix oscilloscopes, pressing the front panel Bus button enables you to define inputs to the scope as a bus. By simply entering the basic parameters of the Ethernet bus including the speed and type of signal, the input channel, and voltage thresholds, as shown at the left, you enable the oscilloscope to understand the information being transmitted across the bus. The Ethernet bus is a differential signal. Although the oscilloscope can acquire and decode the bus using single-ended probing, the signal fidelity and noise immunity is improved by using differential probing.
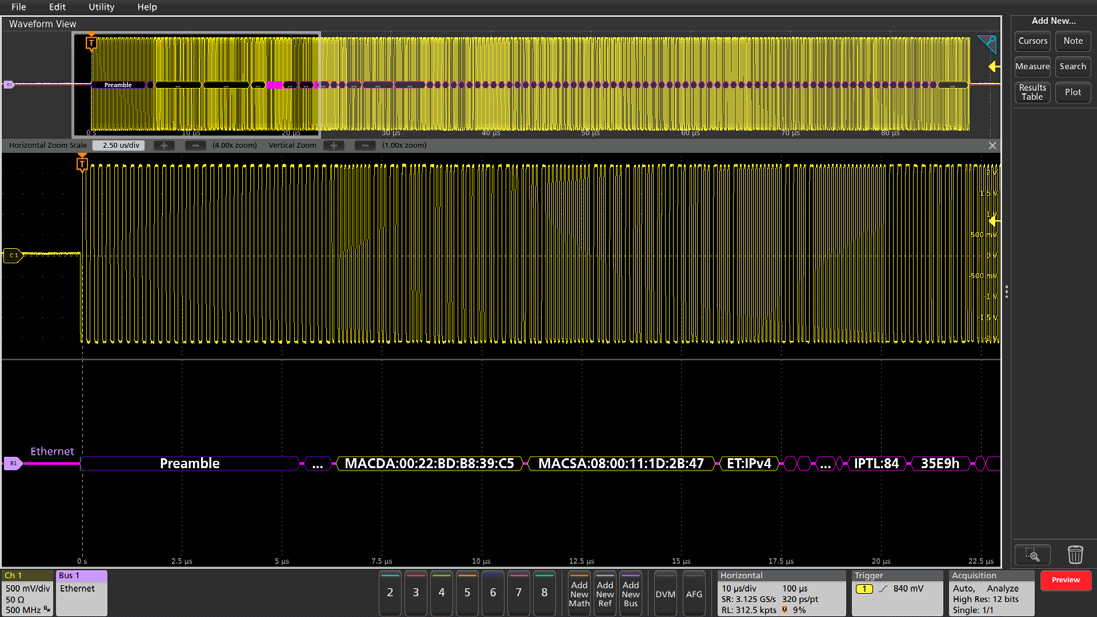
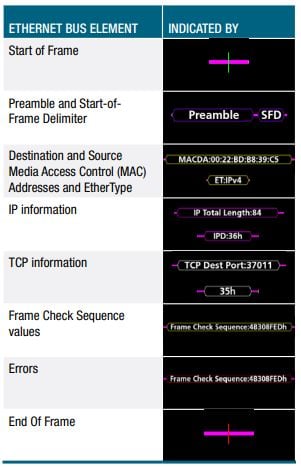
The decoded display provides a higher-level, combined view of the individual signals that make up 10BASE-T and 100BASE-TX, making it easy to identify where packets begin and end as well as sub-packet components. Each packet on the bus is decoded, and the value can be displayed in hex, binary, or ASCII in the bus waveform.
In addition to seeing decoded packet data on the bus waveform itself, you can view all captured packets in a tabular view much like you would see in a software listing. Packets are time stamped and listed consecutively with columns for each component (Time, Destination Address, Source Address, Length, Data, FCS/CRC, Errors).
On the 5 Series MSO, the Results Table view links back to the waveform displays. You can tap a line in the tabular display and the oscilloscope automatically zooms in on the corresponding bus signals and resulting decoded bus waveform, shown in the lower section of the screen.
|
TRIGGER ON |
DESCRIPTION |
|
Start of Frame |
Start of Frame Delimiter |
|
MAC Addresses |
MAC Destination and Source Addresses |
|
MAC Length/Type |
MAC Length or EtherType (e.g. IPV4) |
|
IP Header |
IP Protocol and Destination and Source Addresses |
|
TCP Header |
TCP Source and Destination Ports, Sequence and Ack Numbers |
|
Client Data |
Data Values |
|
End of Packet |
End of Packet Delimiter |
|
Idle |
Idle State |
|
FCS (CRC) Error |
Frame Check Sequence Error |
TRIGGERING ON THE 10BASE-T ETHERNET BUS
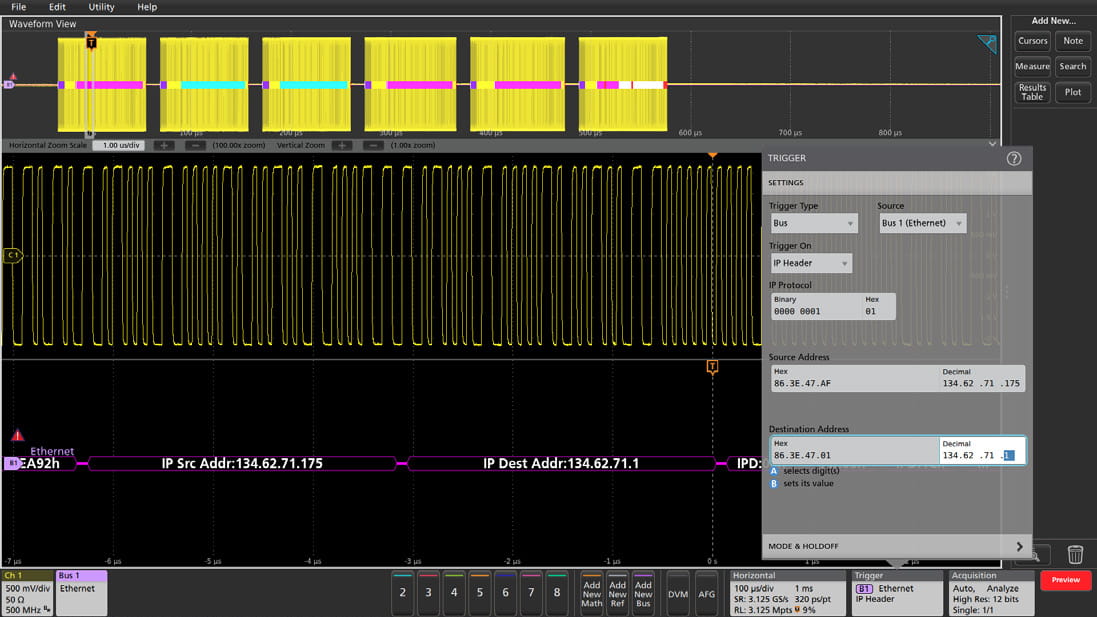
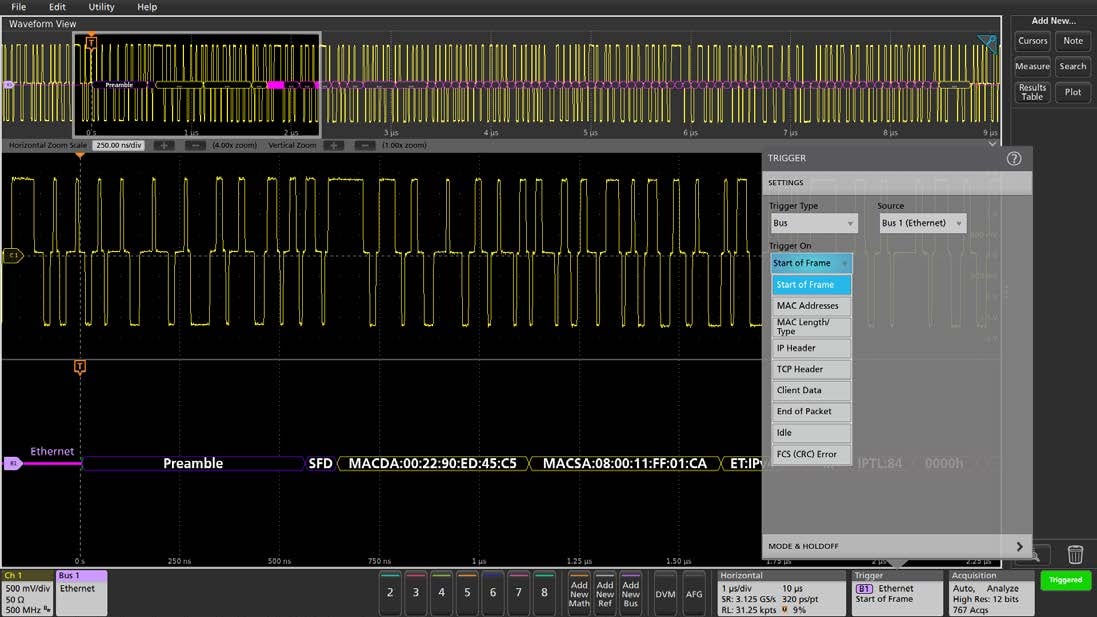
The automated analysis on the oscilloscope can be configured to isolate, capture and display specific values on the bus. In this example the oscilloscope is set to trigger on a 10BASE-T
Ethernet data transfer from IP Address 134.62.71.175 to IP Address 134.62.71.1.
The oscilloscope can trigger on the Ethernet packet content shown in the table.
SEARCHING ON THE ETHERNET BUS
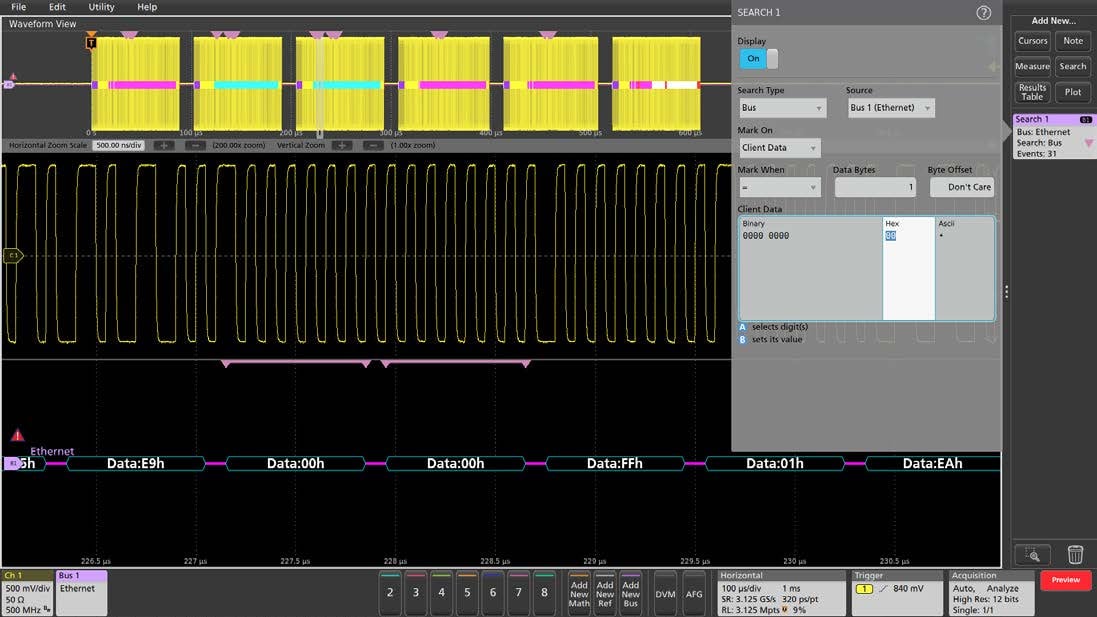
Serial triggering is very useful for isolating the event of interest, but once you’ve captured it and need to analyze the surrounding data, what do you do? Simply use Wave Inspector to automatically search through the acquired data for user-defined criteria including serial packet content.
Search options are the same as the trigger options shown on the previous page. In this example, search is set up to look for data values of 0x00 and it found 31 events. Each occurrence is highlighted by a search mark. Rapid navigation between marks is as simple as pressing the Previous and Next buttons on the oscilloscope front panel.
WORKING WITH 100BASE-TX BUSES
Setting up a 100BASE-TX bus is similar to setting up a 10BASE-T bus. You define a 100BASE-TX Ethernet bus by entering the basic parameters of the bus including the speed and type of signal, the input channel, and voltage thresholds.
Unlike the 10BASE-T signal which has visible bursts of signal activity, the 100BASE-TX signal is almost constantly transitioning because of the scrambling that is used, even in the idle state. So protocol-aware bus triggering is especially important, even for simply viewing the decoded bus information. In this case, the default Trigger On Start of Frame provides a stable display.
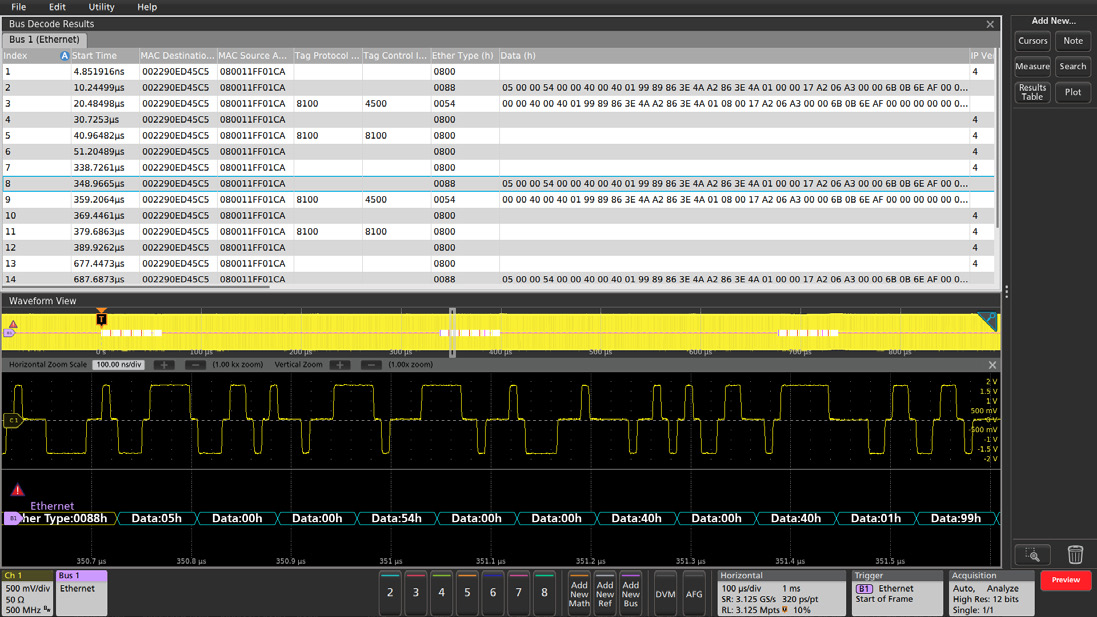
Adding the Results Table view of the decoded information provides a timestamped display of the bus activity that can be easily compared to the software listings. Tapping a line in the Results Table automatically zooms in on the corresponding bus signals and resulting decoded bus waveform, shown in the lower section of the display.
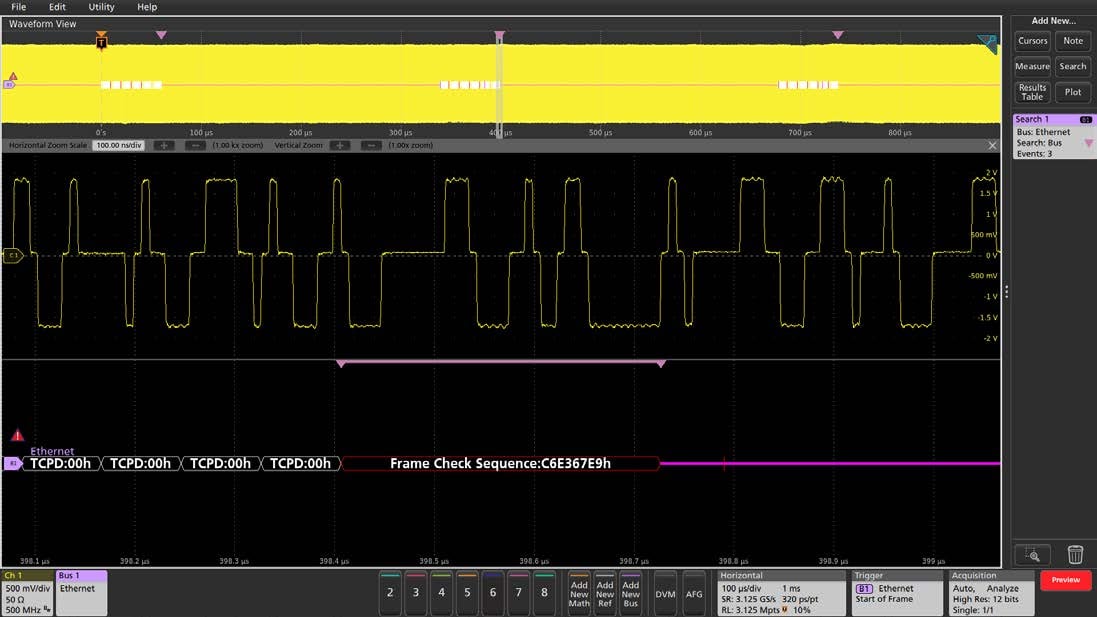
The decoded bus display above shows that three bursts of bus activity were captured. To find specific values in the activity, you can use Wave Inspector automatic search to mark each specified evet. In this example, the automated bus search is configured to find all Frame Check Sequence errors and it shows 3 events, at the end of each burst of bus activity.
Copyright © Tektronix. All rights reserved. Tektronix products are coverwed by U.S. and foreign patents, issued and pending. Information in this publication supersedes that in all previously published material. Specification and price change privileges reserved. TEKTRONIX and TEK are registered trademarks of Tektronix, Inc. All other trade names referenced are the service marks, trademarks or registered trademarks of their respective companies.
06/18
EA 55W-61093-1
