
In our highly wireless world, interference is an unwelcome addition to the equation that results in noise, interrupts cell phone calls and just generally messes up communication. In the case of cellular networks, interference is actually part of the network. While more networks today have built-in features to detect interference, these tools often lack context as they are geared towards only a few types of signals and may only be able to measure the impact of the problem over a single channel.
A spectrum analyzer is the trusted tool that engineers use to measure and identify sources of interference. There are many types of spectrum analyzers on the market, but many people opt for small battery-powered spectrum analyzer models because they need to be able to move around freely and correlate data from multiple locations.
When on the hunt for interference the first challenge is to determine if it’s even possible to measure the interfering signal. Typically, a victim receiver, which is the first place to look, is easy to identify. The challenge is that radio receivers are able to detect very small signals. Therefore, the spectrum analyzer must be set up to closely mimic the sensitivity of the victim receiver to “see” what the receiver is “seeing.” For example, an average LTE receiver has a sensitivity in the area of -120dBm. This means that any RF pollution on the receiver channel that is greater than -120dBm can affect the operation of the receiver.
There are two controls in the spectrum analyzer to adjust sensitivity: reference level (RefLvl) and resolution bandwidth (RBW). The challenge is that when taking measurements “over the air” (OTA), the reference level needs to be kept fairly high (-30dBm), so that the spectrum analyzer doesn’t become overloaded with all of the RF energy being measured.
In most spectrum analyzers the RBW control is set automatically based on the frequency span that the user has configured. In OTA measurements RBW values should be reduced in order to see small signals that could be affecting the victim receiver. This combination results in a very slow sweep rate for most battery-powered spectrum analyzers which means that it’s almost impossible to see intermittent low-level transient signals that are causing the interference.
Real-time spectrum analyzers address this shortcoming by being able to measure the spectrum with a narrower RBW filter, faster than basic sweeping spectrum analyzers. The screen shot below provides an example of what a LTE signal looks like OTA. In this case the span is set to 40 MHz, which results in a default RBW of 300 kHz. Note that determining the emission in the center of the display is quite difficult. If there was a narrow-band (< 300kHz) interferer it would be almost impossible to see it with this setup.

This is an example of how an LTE signal looks OTA.
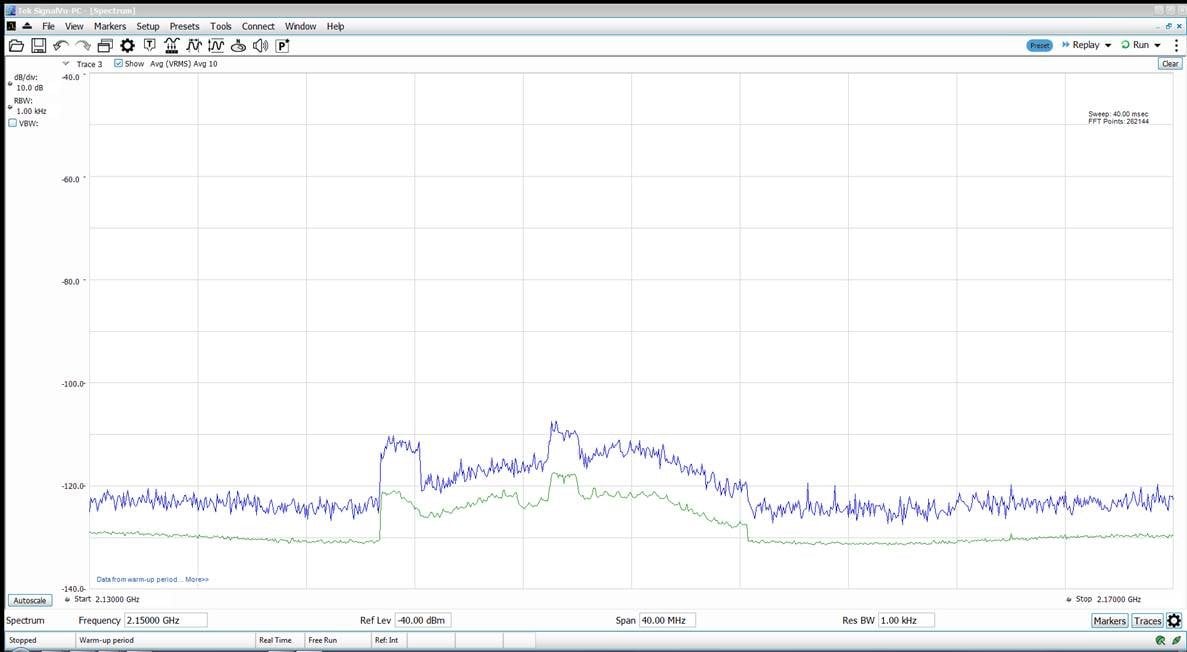
The story is much different in the figure below with shows the same setup using a 1kHz RBW filter. In this case, it’s clear that the LTE channel and the effective sweep time has only increased to 40 msec. This is one of the first benefits of using a real-time spectrum analyzer (RTSA) to measure interference on the radio channel. Once expensive and desk-bound, a new class of affordable, battery-powered, USB-based real-time spectrum analyzers such as the Tektronix RSA306 are now becoming available on the market, making RTSA a practical choice for interference-hunting applications.

A Tektronix real-time spectrum analyzer with a 1kHz RBW filter improves visibility on a LTE signal.
In Part 2 of this four-part series, we will talk about collecting information over time to determine “how often” our interference is on.
For more information on spectrum management and interference hunting be sure to visit our resource center. You’ll find a wealth of information such as our handy e-guide to RF Signals.
Read the other entires in this series here:
Part 2: How often is the interference happening?
Part 3: Use Mask Search to automatically discover when interference is happening
Part 4: Storing and sharing captures, the interference hunter’s safety net
About the Author
Robin Jackman is a field applications engineer based in Toronto, Ontario. He has been with Tektronix for more than 15 years supporting customer applications throughout North America. His work with Tektronix has covered both analog and digital design with a focus on RF applications. Prior to Tektronix he spent 12 years working for the federal government in spectrum management.


