Свяжитесь с нами
Живой чат с представителями Tektronix. С 9:00 до 17:00 CET
Позвоните нам 1-800-833-9200
С 9:00 до 17:00 CET
Загрузить
Загрузить руководства, технические описания, программное обеспечение и т. д.:
Обратная связь
RF and Vector Signal Analysis for Oscilloscopes
SignalVu® Datasheet
Дополнительные сведения
- Поддержка приборов
- DPO70000SX
- DPO7000
- MSO/DPO70000
- ПО анализа для осциллографов
- Осциллограф смешанных сигналов MSO/DPO5000B
- Explore more Software models
Читать на веб-сайте:
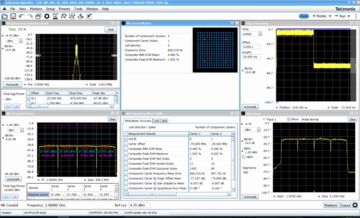
SignalVu RF and vector signal analysis software combines analysis engine of the real time spectrum analyzer with that of the industry's leading digital oscilloscopes, making it possible for designers to evaluate complex signals without an external down converter. You get the functionality of a vector signal analyzer, a spectrum analyzer, and the powerful trigger capabilities of a digital oscilloscope - all in a single package. You can use SignalVu with a DPO/MSO70000 Series digital oscilloscope to easily validate wideband designs and characterize wideband spectral events. Whether your design validation needs include wideband radar, high data rate satellite links, and wireless LAN, WiGig IEEE 802.11ad/ay, or frequency-hopping communications, SignalVu can speed your time-to-insight by showing you the time-variant behavior of these wideband signals.
Key features
- Trigger
- Integrated RF signal analysis package lets you take full advantage of oscilloscope settings
- Pinpoint™ triggering offers over 1400 combinations to address virtually any triggering situation
- Capture
- Direct observation of microwave signals on up to 4 channels simultaneously
- All signals up to the analog bandwidth of oscilloscope are captured into memory
- Customize oscilloscope acquisition parameters for effective use of capture memory
- FastFrameTM segmented memory captures signal bursts without storing the signal's off time
- Supports RF, I and Q, and differential I and Q signals using the oscilloscope's 4 analog inputs
- Analyze
- 5G New Radio (NR) uplink/downlink RF power, Power dynamics, Signal quality, and Emissions measurements based on the 3GPP release 15/16 Standard
- Extensive time-correlated, multidomain displays connect events in time, frequency, phase, and amplitude for quicker understanding of cause and effect when troubleshooting
- Power measurements and signal statistics help you characterize components and systems: SEM, Multicarrier ACLR, Power vs. Time, CCDF, OBW/EBW, and Spur Search
- WLAN spectrum and modulation transmitter measurements based on IEEE 802.11 a/b/g/j/p/n/ac standards (Opts. SV23, SV24, and SV25)
- WiGig IEEE 802.11ad/ay Spectral and modulation transmitter measurements (Opt. SV30)
- Bluetooth® Transmitter Measurements based on Bluetooth SIG RF Specifications for Basic Rate and Low Energy. Some support of Enhanced Data Rate. (Option SV27)
- LTE™ FDD and TDD Base Station (eNB) Transmitter RF measurements (Option SV28)
- Complete APCO Project 25 transmitter testing and analysis for Phase 1 (C4FM) and Phase 2 (TDMA) (Opt. SV26)
- AM/FM/PM Modulation and Audio Measurements (Opt. SVA) for characterization of analog transmitters and audio signals
- Settling Time Measurements, Frequency, and Phase (Opt. SVT) for characterization of wideband frequency-agile oscillators
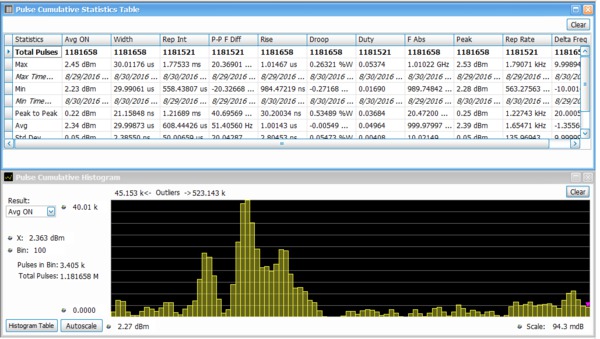
- Advanced pulse analysis suite (Opt. SVP) provides deep insight into pulse train behavior. Measure pulse statistics over many acquisitions (millions of pulses). Multi-channel support enabled with MSO/DPO oscilloscopes
- General purpose digital modulation analysis (SVM) provides modulation analysis of 26 modulation types, from FSK to 1024QAM. Multi-channel analysis is enabled with MSO/DPO oscilloscopes
- Flexible OFDM analysis (Opt. SVO) with support for 802.11a/g/j and WiMAX 802.16-2004 signals
- Frequency offset control for analyzing baseband signals with near-zero intermediate frequencies (IF)
- Tektronix OpenChoice® makes for easy transfer to a variety of analysis programs such as Excel and Matlab
Applications
- Wideband radar and pulsed RF signals
- Frequency agile communications
- Broadband satellite and microwave backhaul links
- Phased array and beam forming systems
- Wireless LAN, WiGig, Bluetooth, Commercial Wireless
- Land Mobile Radio (LMR), APCO P25
- Long Term Evolution (LTE), Cellular
- 5G NR Cellular base station or user equipment transmitter test
Wideband signal characterization
SignalVu helps you easily validate wideband designs and characterize wideband spectral events using DPO70000SX or MSO/DPO70000DX oscilloscopes. You can easily switch between the SignalVu application and the oscilloscope's user interface to optimize the collection of wideband signals.
Trigger
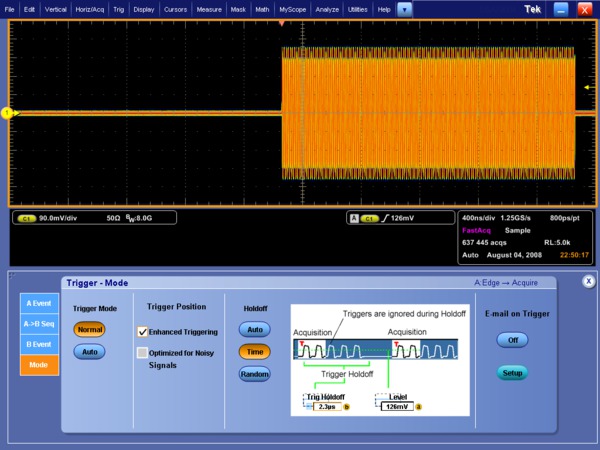
SignalVu software works seamlessly with the oscilloscope allowing users to utilize all of its powerful triggering capabilities. The ability to trigger on time- and amplitude-varying events of interest is paramount in wideband system design, debug, and validation. The Tektronix oscilloscopes' trigger systems allow selection of virtually all trigger types on both A and B trigger events, whether they be transition, state, time, or logic qualified triggers. Fundamental triggers (such as Edge) can be configured from the SignalVu user interface directly. While a full assortment of triggers can be configured from the oscilloscope software application. Once triggered, SignalVu processes the acquisition for analysis in multiple domains.
Capture
Capture once - make multiple measurements without recapturing. All signals in an acquisition bandwidth are recorded into the oscilloscope's deep memory. Up to four channels can be captured and analyzed simultaneously by SignalVu software. Channels can be RF, I and Q, or differential inputs. Users can also apply math functions to the acquisition prior to analysis by SignalVu. Acquisition lengths vary depending upon the selected capture bandwidth and up to 2.5 ms can be captured on a single channel with the DPO/MSO70000 Series. Significantly longer capture times can be realized with lower oscilloscope sample rates.
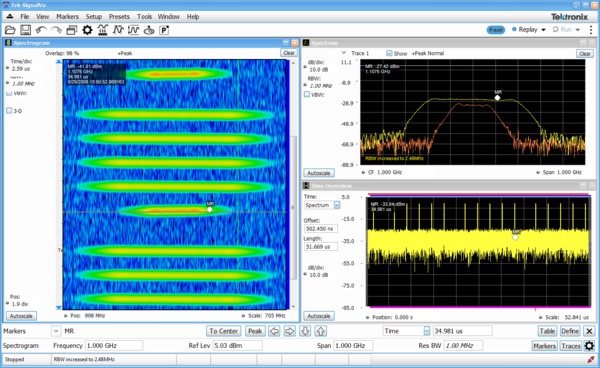
Using the FastFrame segmented memory feature in SignalVu enables you to capture events of interest, such as low duty cycle pulsed signals, while conserving acquisition memory. Using multiple trigger events, FastFrame captures and stores short-duration, bursty signals and passes them to SignalVu vector signal analysis functions. Capturing thousands of frames is possible, so long-term trends and changes in the bursty signal can be analyzed.
Analyze
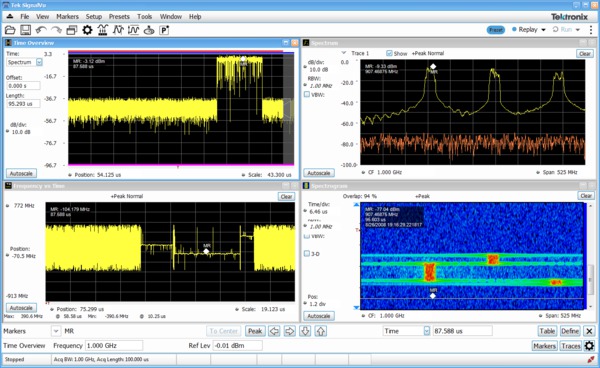
SignalVu RF and vector signal analysis software use the same analysis capabilities found in the real time spectrum analyzers. SignalVu advances productivity for engineers working on components or in wideband RF system design, integration, and performance verification, or operations engineers working in networks, or spectrum management. In addition to spectrum analysis, spectrograms display both frequency and amplitude changes over time. Time-correlated measurements can be made across the frequency, phase, amplitude, and modulation domains. This is ideal for signal analysis, that includes frequency hopping, pulse characteristics, modulation switching, settling time, bandwidth changes, and intermittent signals.
SignalVu can process RF, I and Q, and differential I and Q signals from any one of the four available oscilloscope inputs. Math functions applied by the oscilloscope are also utilized by SignalVu, allowing users to apply custom filtering prior to vector signal analysis.
The Microsoft Windows environment makes this multidomain analysis even easier with an unlimited number of analysis windows, all time-correlated, to provide deeper insight into signal behavior. A user interface that adapts to your preferences (keyboard, front panel, touch screen, and mouse) makes learning SignalVu easy for both first-time users and experienced hands.
Multi-channel support
Beginning with SignalVu v5.3, you gain the capability to perform wideband multi-channel acquisition and analysis of up to 33 GHz in frequency and bandwidth on 4 channels using Tektronix DPO70000SX or MSO/DPO70000DX oscilloscopes. Or 50 to 70 GHz on 4 channels using a stack of four instruments. Tight synchronization of multiple instruments using the UltraSync™ architecture provides configuration flexibility, allowing you to easily add acquisition channels and maintain channel-to-channel timing accuracy. Greater than four channels can be acquired and analyzed through a combination of programmatic control and separate instances of SignalVu. Supported multi-channel displays include the general signal viewing (opt. SVE), advanced pulse radar analysis (SVP), and general-purpose digital modulation analysis (SVM) displays. This advancement empowers you to attain a thorough comprehension of multi-emitter RADAR/EW pulse train behavior, non-contiguous uplink/downlink systems, and phased-array systems spanning parameters pertaining to RF power, time, quality/integrity, frequency, and phase.
For applications requiring up to eight channels at less than 10 GHz in frequency, and up to 2 GHz in analysis bandwidth, the 5 or 6 Series MSO oscilloscopes with SignalVu-PC are more suitable. Refer to the SignalVu-PC datasheet for more detail.

Shared acquisition multi-signal support
SignalVu software expands your analysis capabilities even further on oscilloscope by enabling simultaneous analysis of multiple frequency dispersed signals within a single acquisition bandwidth. By configuring multiple sources to one physical oscilloscope channel, it supports independent analysis of signals at different frequency bands from I/Q data acquired by a single channel. This capability offers critical insights into advanced, multi-standard systems, streamlining development and validation.
One example among many where such analysis is beneficial involves electronic warfare or military communications research, where analyzing pulse radar and 64QAM signals simultaneously on the same medium helps test and ensure system reliability under mixed signal conditions.
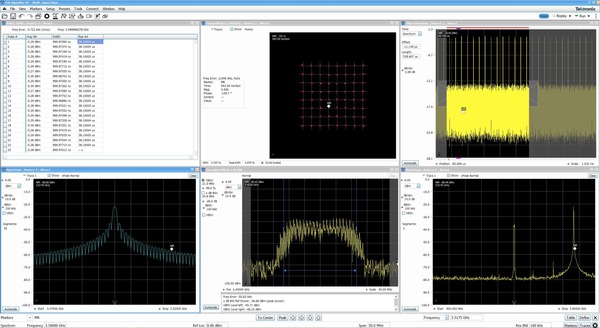
Options tailored for your wideband applications
SignalVu RF and vector signal analysis software offers options to meet your specific application, whether it be wideband radar characterization, broadband satellite, or spectrum management. SignalVu Essentials (Opt. SVE) provides the fundamental capability for all measurements and is required for pulse analysis (Opt. SVP), settling time (Opt. SVT), digital modulation analysis (Opt. SVM), flexible OFDM analysis, and AM/FM/PM Modulation and Audio Measurements (Opt. SVA).
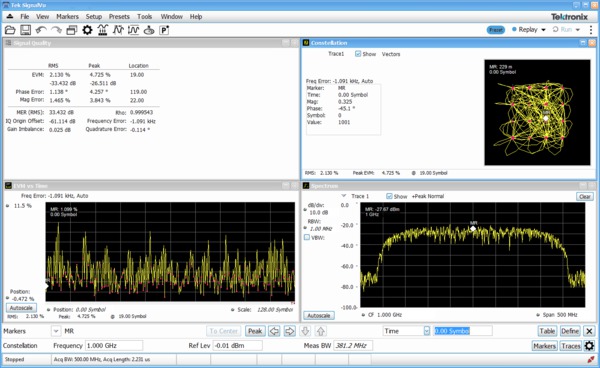
From FSK to 1024QAM, general purpose digital modulation analysis (SVM) provides precise modulation accuracy and essential physical layer measurements for 26 prevalent digital modulation types.
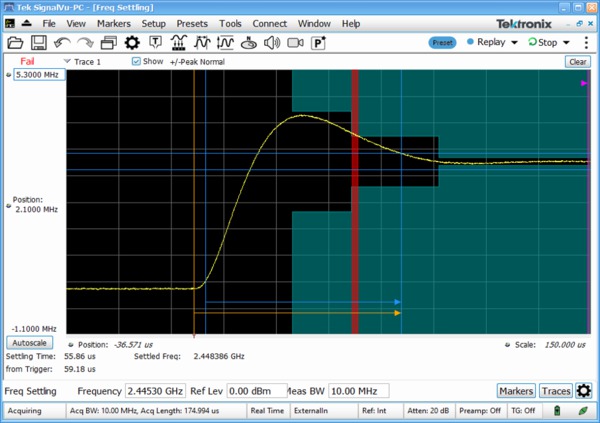
Settling time measurements (Opt. SVT) are easy and automated. You can select measurement bandwidth, tolerance bands, reference frequency (auto or manual), and establish up to 3 tolerance bands vs. time for Pass/Fail testing. Settling time may be referenced to external or internal trigger, and from the last settled frequency or phase. In the illustration, frequency settling time for a hopped oscillator is measured from an external trigger point from the device under test.
Advanced pulse analysis
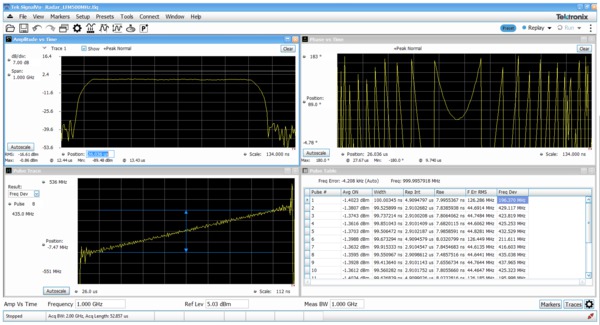
The Advanced Pulse Analysis package (Opt. SVP) provides 31 individual measurements to automatically characterize the long pulse trains. A 500 MHz wide LFM chirp centered at 1 GHz is seen here with the measurements for pulses 1 through 10 (lower right). The shape of the pulse can be seen in the Amplitude vs. Time plot shown in the upper left. Detailed views of pulse number 8's frequency deviation and parabolic phase trajectory are shown in the other two views.
SignalVu (v5.3) software provides wideband multi-channel analysis up to 70 GHz or 33 GHz on four channels using Tektronix DPO70000SX or MSO/DPO70000DX oscilloscopes.1
WLAN transmitter testing
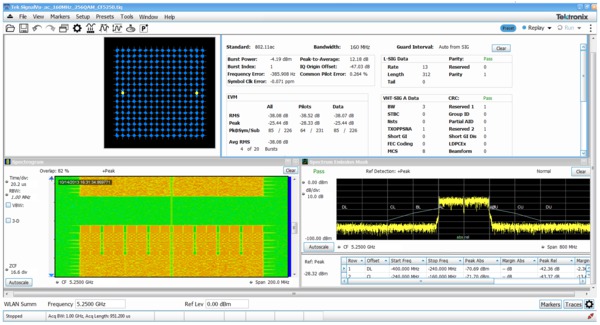
With the WLAN measurement options, you can perform standards-based transmitter measurements in the time, frequency, and modulation domains.
- Option SV23 supports IEEE 802.11a, b, g, j and p signals
- Option SV24 supports IEEE 802.11n 20 MHz and 40 MHz SISO signals
- Option SV25 supports IEEE 802.11ac 20/40/80/160 MHz SISO signals
The table below described the modulation formats and frequency bands of IEEE 802.11 WLAN signals
| Standard | Std PHY | Freq bands | Signal | Modulation formats | Bandwidth (max) | 802.11- 2012 section |
|---|---|---|---|---|---|---|
| 802.11b | DSSS HR/DSSS | 2.4 GHz | DSSS/CCK 1 - 11 Mbps | DBSK, DQPSK CCK5.5M, CCK11M | 20 MHz | 16 & 17 |
| 802.11g | ERP | 2.4 GHz | DSSS/CCK/PBCC 1 - 33 Mbps | BPSK DQPSK | 20 MHz | 17 |
| 802.11a | OFDM | 5 GHz | OFDM 64 <54 Mbps | BPSK QPSK 16QAM 64QAM | 20 MHz | 18 |
| 802.11g | 2.4 GHz | 20 MHz | 19 | |||
| 802.11j/p | 5 GHz | 5, 10, 20 MHz | 18 | |||
| 802.11n | HT | 2.4 GHz & 5 GHz | OFDM 64, 128 ≤ 150 Mbps | BPSK QPSK 16QAM 64QAM | 20 , 40 MHz | 20 |
| 802.11ac | VHT | 5 GHz | OFDM 64, 128, 256, 512 ≤ 867 Mbps | BPSK QPSK 16QAM 64QAM 256QAM | 20, 40, 80, 160 MHz | 22 |
The Frequency Band (Freq Bands) provides the minimum requirement for the bandwidth of the oscilloscope to use.
Inside SignalVu, the WLAN presets make the EVM, Constellation and SEM measurements push-button. The WLAN RF transmitter measurements are defined by the IEEE 802.11- 2012 revision of the standard and listed below with the reference to the section and the limit to reach.
| IEEE 802.11 RF layer test | IEEE reference 802.11-2012 | Limit tested |
|---|---|---|
| Transmit Power On/Off Ramp | 16.4.7.8 (DSSS) | (10%-90%) 2 usec |
| 7.4.7.7 ("b") | (10%-90%) 2 usec | |
| Transmit Spectrum mask | 16.4.7.5 (DSSS) | std mask |
| 17.4.7.4 ("b") | std mask | |
| 18.3.9.3("a") | std mask | |
| 19.5.5 ("g") | std mask | |
| 20.3.20.1 ("n") | std mask | |
| 22.3.18.1 ("ac") | std mask | |
| RF Carrier suppression | 16.4.7.9 ("DSSS") | -15 dB |
| 17.4.7.8 ("b") | -15 dB | |
| Centre frequency leakage | 18.3.9.7.2 ("a") | -15 dB or +2 dB with respect to average subcarrier power |
| 20.3.20.7.2 ("n") | 20 MHz follow 18.3.9.7.2 | |
| 40 MHz: -20 bBc or 0 dB with respect to average subcarrier power | ||
| Transmit Spectral flatness | 18.3.9.7.3 ("a") | +/-4 dB (SC = -16... 16), +4/-6 dB (other) |
| 20.3.20.2 ("n") | +/-4 dB, +4/-6 dB | |
| 22.3.18.2 ("ac") | +/-4 dB, +4/-6 dB (various BWs, 20-160 MHz) | |
| Transmit Centre frequency tolerance | 16.4.7.6 ("DSSS") | +/-25 ppm |
| 17.4.7.5 ("b") | +/-25 ppm | |
| 18.3.9.5 ("a") | +/-20 ppm (20 MHz and 10 MHz), +/-10 ppm (5 MHz) | |
| 19.4.8.3 ("g") | +/-25 ppm | |
| 20.3.20.4 ("n") | +/-20 ppm (5 Hz band), +/-25 ppm (2.4 GHz band) | |
| 22.3.18.3 ("ac") | +/-20 ppm | |
| Symbol clock frequency tolerance | 16.4.7.7 ("DSSS") | +/-25 ppm |
| 17.4.7.6 ("b") | +/-25 ppm | |
| 18.3.9.6 ("a") | +/-20 ppm (20 MHz and 10 MHz), +/- 10 ppm (5 MHz) | |
| 19.4.8.4 ("g") | +/-25 ppm | |
| 20.3.20.6 ("n") | +/-20 ppm (5 GHz band), +/-25 ppm (2.4 GHz band) | |
| 22.3.18.3 ("ac") | +/-20 ppm | |
| Transmit Modulation accuracy | 16.4.7.10 ("DSSS") | Peak EVM < 0.35 |
| 17.4.7.9 ("b") | Peak EVM < 0.36 |
| IEEE 802.11 RF layer test | IEEE reference 802.11-2012 | Limit tested | ||
|---|---|---|---|---|
| Transmitter Constellation Error | 18.3.9.7.4 ("a") | Modulation | Coding rate (R) | Relative constellation error (dB) |
| BPSK | 1/2 | -5 | ||
| BPSK | 3/4 | -8 | ||
| QPSK | 1/2 | -10 | ||
| QPSK | 3/4 | -13 | ||
| 16-QAM | 1/2 | -16 | ||
| 16-QAM | 3/4 | -19 | ||
| 64-QAM | 2/3 | -22 | ||
| 64-QAM | 3/4 | -25 | ||
| 20.3.20.7.3 ("n") | BPSK | 1/2 | -5 | |
| QPSK | 1/2 | -10 | ||
| QPSK | 3/4 | -13 | ||
| 16-QAM | 1/2 | -16 | ||
| 16-QAM | 3/4 | -19 | ||
| 64-QAM | 2/3 | -22 | ||
| 64-QAM | 3/4 | -25 | ||
| 64-QAM | 5/6 | -27 | ||
| 22.3.18.4.3 ("ac") | BPSK | 1/2 | -5 | |
| QPSK | 1/2 | -10 | ||
| QPSK | 3/4 | -13 | ||
| 16-QAM | 1/2 | -16 | ||
| 16QAM | 3/4 | -19 | ||
| 64-QAM | 2/3 | -22 | ||
| 64-QAM | 3/4 | -25 | ||
| 64-QAM | 5/6 | -27 | ||
| 256-QAM | 3/4 | -30 | ||
| 256-QAM | 5/6 | -32 | ||
WiGig IEEE802.11ad/ay transmitter testing
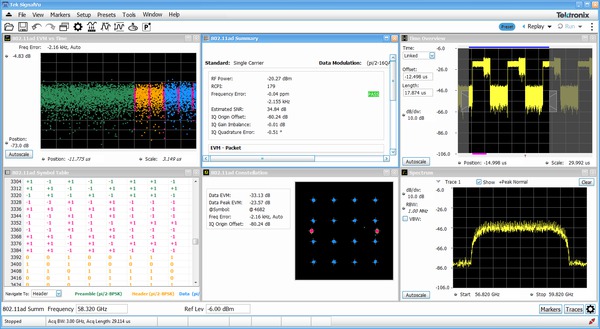
Option SV30 provides comprehensive analysis for WiGig IEEE802.11ad/ay IC characterization. Used together with the DPO77002SX, it delivers the industry's most accurate signal quality measurement at 60 GHz. Automatically detect the packet start, as well as decode packet information in the Header; synchronize to preamble using the Golay codes in the short training field; demodulates preamble, header, and payload separately; and measures EVM in each of these sections per the standard.
SV30 provides significant margin in EVM performance compared to what is required by the standard. Channel Impulse coefficients are also available. Both Control PHY (802.11ad) and Single Carrier PHY (802.11ad and 802.11ay) are supported and this option provides analysis of 802.11ay 2.16 GHz packets or 4.23 GHz adjacent 2-channel bonded packets.
Testing and verification can be done on IF and RF setups. RF power, Received Power Indicator (RCPI), Frequency error (Max, Average, Std. Deviation), DC Offset, IQ DC origin offset, IQ Gain and Phase imbalance, Signal Quality, and estimated SNR measurements are reported in the Summary display. Pass/Fail results are reported using customizable limits and the presets make the test set-up push-button.
For further insight into the signal, color coding is available in the user interface, allowing you to visualize the EVM spread across the analyzed packet with color codes differentiating regions. You can also view the demodulated symbols in tabular form with different color codes and with an option to traverse to the start of each region for easier navigation.
| Modulation formats | 802.11ad: MCS0-12.6 802.11ay: MCS1-21 |
802.11ad/ay Single carrier: π/2 BPSK, π/2 QPSK, π/2 16QAM, π/2 64QAM 802.11ad Control PHY: π/2 DBPSK | |
| Measurements | RF output power, Received Channel Power Indicator (RCPI), Estimated SNR, Frequency Error, Symbol Rate Error, IQ Origin Offset, IQ Phase Imbalance, IQ Gain Imbalance, IQ Quadrature Error, EVM results for each packet region (STF, CEF, Header and Data). Packet information includes the Packet type, Preamble, Synchronization Word or Access Code, Packet Header, Payload length, and CRC details. |
| Displays | Constellation, EVM vs Time, Symbol Table, Summary |
802.11ad MCS0-12.6 | 802.11ay MCS1-21 | |
| Channel1-4 | 1.2 - 1.6% (-38.4 to -35.9 dBc) | 1.2 - 1.6% (-38.4 to -35.9 dBc) |
| Channel 5-6 | 1.4 - 2.5% (-37.1 to -32.0 dBc) | 1.4 - 2.5% (-37.1 to -32.0 dBc) |
| Channel 1-2, 2-3, 3-4 (adjacent bonded) | NA | 1.2 - 1.7% (-38.4 to -35.4 dBc) |
| Channel 4-5, 5-6 (adjacent bonded) | NA | < 2.5% (< -32.0 dBc) |
Bluetooth transmitter testing
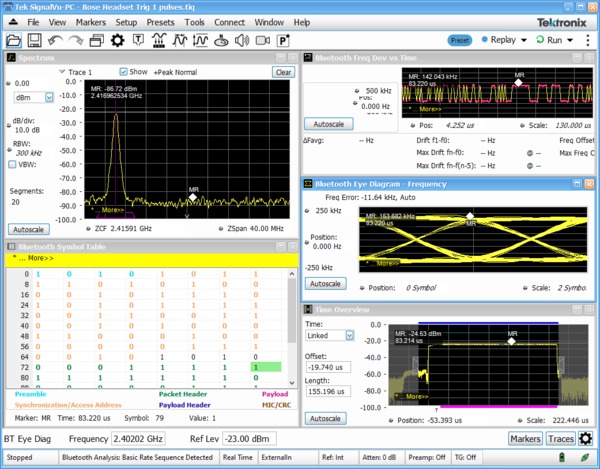
Two options have been added to help with Bluetooth SIG standard base transmitter RF measurements in the time, frequency and modulation domains. Option SV27 supports Basic Rate and Low Energy Transmitter measurements defined by RF.TS.4.2.0 and RF-PHY.TS. 4.2.0 Test Specification. It also demodulates and provides symbol information for Enhanced Data Rate (EDR) packets. Option SV31 supports Bluetooth 5 standards (LE 1M, LE 2M, LE Coded) and measurements defined in the Core Specification. Both options also decode the physical layer data that is transmitted and color-encode the fields of packet in the Symbol Table for clear identification.
Pass/Fail results are provided with customizable limits and the Bluetooth presets make the different test set-ups push-button.
Below is a summary of the measurements that are automated with option SV27 and SV31 (unless noted):
- Bluetooth Low Energy (BLE) Transmitter Measurements
- Output power at NOC TRM-LE/CA/01/C and at EOC TRM-LE/CA/02/C
- In-band emission at NOC TRM-LE/CA/03/C and at EOC TRM-LE/CA/04/C
- Modulation characteristics TRM-LE/CA/05/C
- Carrier frequency offset and drift at NOC TRM-LE/CA/06/C and at EOC TRM-LE/CA/07/C
- Basic Rate Transmitter Measurements
- Output power TRM/CA/01/C
- Power Density TRM/CA/02/C (no preset)
- Power Control TRM/CA/03/C (no preset)
- Tx output Spectrum – Frequency Range TRM/CA/04/C (no preset)
- Tx output spectrum - 20 dB Bandwidth TRM/CA/05/C
- Tx output spectrum - Adjacent Channel Power TRM/CA/06/C
- Modulation characteristics TRM/CA/07/C
- Initial carrier frequency tolerance TRM/CA/08/C
- Carrier frequency-drift TRM/CA/09/C
The following additional information is also available with SV27 and SV31: symbol table with color coded field information, constellation, eye diagram, frequency deviation vs time with highlighted packet and octet, frequency offset and drift detailed table, as well as packet header field decoding. Markers can be used to cross-correlate the time, vector and frequency information.
5G NR modulation analysis and measurements option
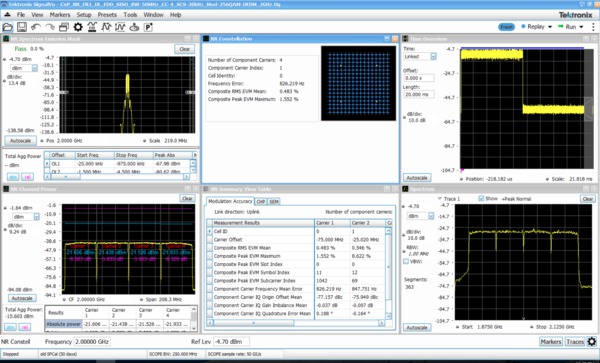
5G NR is among the growing set of signal standards, applications, and modulation types supported by SignalVu Vector Signal Analysis (VSA) software. The SignalVu VSA 5G NR analysis option provides comprehensive analysis capabilities in the frequency, time, and modulation domains for FR1 and FR2 (mmWave) signals based on the 3GPP’s 5G NR specification.
By configuring result traces of spectrum, acquisition time, and NR specific modulation quality (e.g, EVM, frequency error, I/Q error) traces and tables, engineers can identify overall signal characteristics and troubleshoot intermittent error peaks or repeated synchronization failures.
Error Vector Magnitude (EVM) is a figure of merit used to describe signal quality. It does this by measuring the difference on the I/Q plane between the ideal constellation point of the given symbol versus the actual measured point. It can be measured in dB or % of the ideal sub-symbol, normalized to the average QAM power received, and display constellation of symbols vs ideal symbol. The EVM vs Symbol or EVM vs Time gives the EVM of OFDM symbols present in the number of symbols considered or the time within a slot.
For automated testing, SCPI remote interfaces are available to accelerate design, which enables the quick transition to the design verification and manufacturing phases.
5G NR transmitter measurements core supported features
5G NR option (Opt. 5GNR) supports 5G NR modulation analysis measurements according to Release 15 and Release 16 of 3GPP’s TS38 specification, including:
- Analysis of uplink and downlink frame structures
- 5G NR measurements and displays including
- Modulation Accuracy (ModAcc)
- Channel Power (CHP)
- Adjacent Channel Power (ACP)
- Spectrum Emission Mask (SEM)
- Occupied Bandwidth (OBW)
- Power Vs Time (PVT)3
- Error Vector Magnitude (EVM)
- Summary table with all scalar results for ModAcc, SEM, CHP, ACP, OBW, PVT, and EVM measurements
- In-depth analysis and troubleshooting with coupled measurements across domains, use multiple markers to correlate results to find root-cause.
- Saves reports in CSV format with configuration parameters and measurement results
- Configurable parameters of PDSCH or PUSCH for each component carrier
- For downlink, supported test models for FDD and TDD per 3GPP specifications
LTE FDD and TDD base station transmitter RF testing
Option SV28 enables the following LTE measurements:
Cell ID
Channel Power
Occupied Bandwidth (OBW)
Adjacent Channel Leakage Ratio (ACLR)
Spectrum Emission Mask (SEM)
Transmitter Off Power for TDD
Reference Signal Power
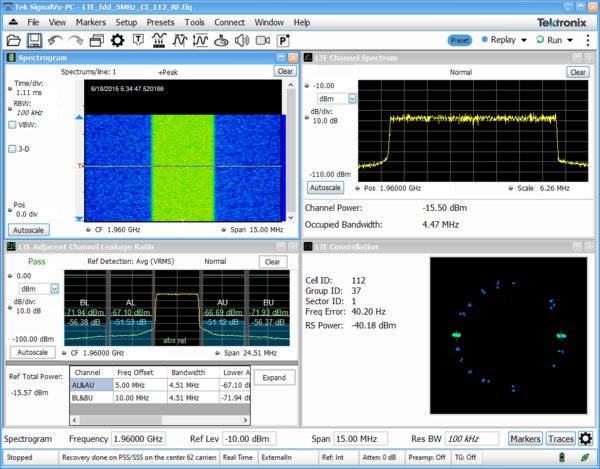
There are four presets to accelerate pre-compliance testing and determine the Cell ID. These presets are defined as Cell ID, ACLR, SEM, Channel Power and TDD Toff Power. The measurements follow the definition in 3GPP TS Version 12.5 and support all base station categories, including picocells and femtocells. Pass/Fail information is reported and all channel bandwidths are supported.
The Cell ID preset displays the Primary Synchronization Signal (PSS) and the Secondary Synchronization Signal (SSS) in a Constellation diagram. It also provides Frequency Error and Reference Signal (RS) Power.
The ACLR preset measures the E-UTRA and the UTRA adjacent channels, with different chip rates for UTRA. ACLR also supports Noise Correction based on the noise measured when there is no input. Both ACLR and SEM will operate in swept mode (default) or in faster single acquisition if the instrument has enough acquisition bandwidth.
Measurement functions
| Spectrum analyzer measurements
(Opt. SVE) | Channel Power, Adjacent Channel Power, Multicarrier Adjacent Channel Power/Leakage Ratio, Occupied Bandwidth, xdB Down, dBm/Hz Marker, dBc/Hz Marker |
| Time domain and statistical measurements
(Opt. SVE) | RF IQ vs. Time, Amplitude vs. Time, Power vs. Time, Frequency vs. Time, Phase vs. Time, CCDF, Peak-to-Average Ratio, Amplitude, Frequency, and Phase Modulation Analysis |
| Spur search measurements
(Opt. SVE) | Up to 20 ranges, user-selected detectors (peak, average, CISPR peak), filters (RBW, CISPR, MIL) and VBW in each range. Linear or Log frequency scale. Measurements and violations in absolute power or relative to a carrier. Up to 999 violations identified in tabular form for export in CSV format |
| WLAN 802.11a/b/g/j/p measurement application (Opt. SV23) | All of the RF transmitter measurements as defined in the IEEE standard, and a wide range of additional scalar measurements such as Carrier Frequency error, Symbol Timing error, Average/peak burst power, IQ Origin Offset, RMS/Peak EVM, and analysis displays, such as EVM and Phase/Magnitude Error vs time/frequency or vs symbols/ subcarriers, as well as packet header decoded information and symbol table. Option SV23 requires Option SVE Option SV24 requires Option SV23 Option SV25 requires Option SV24 |
| WLAN 802.11n measurement application (Opt. SV24) | |
| WLAN 802.11ac measurement application (Opt. SV25) | |
| APCO P25 compliance testing and analysis application (Opt. SV26) | Complete set of push-button TIA-102 standard-based transmitter measurements with pass/fail results including ACPR, transmitter power and encoder attack times, transmitter throughput delay, frequency deviation, modulation fidelity, symbol rate accuracy, and transient frequency behavior, as well as HCPM transmitter logical channel peak ACPR, off slot power, power envelope, and time alignment.
Option SV26 requires Option SVE |
| Bluetooth Basic LE TX SIG measurements
(Opt. SV27) | Presets for transmitter measurements defined by Bluetooth SIG for Basic Rate and Bluetooth Low Energy. Results also include Pass/Fail information. Application also provides Packet Header Field Decoding and can automatically detect the standard including Enhanced Data Rate. |
LTE Downlink RF measurements (Opt. SV28) | Presets for Cell ID, ACLR, SEM, Channel Power and TDD Toff Power. Supports TDD and FDD frame format and all base stations defined by 3GPP TS version 12.5. Results include Pass/Fail information. Real-Time settings make the ACLR and the SEM measurements fast, if the connected instrument has enough bandwidth. |
| 5G NR measurements (Opt. 5G NR) | Presets for Channel Power (CHP), Adjacent Channel Power (ACP), Power Vs Time (PVT)3, Modulation Accuracy (including Error Vector Magnitude (EVM), Frequency Error, IQ Error), EVM vs. Symbol, Occupied Bandwidth (OBW), Spectral Emission Mask (SEM), Constellation Diagram, and summary table with scalar results. |
| WiGig IEEE 802.11ad/ay measurement application (Opt. SV30) | Presets for Control PHY (802.11ad) and Single Carrier PHY (802.11ad and 802.11ay). The 802.11ay analysis results are shown for the EDMG, PreEDMG1, and PreEDMG2 regions. Both measure EVM in each of the packet fields per the standard, and decodes the header packet information. RF power, Received Channel Power Indicator, Frequency error, IQ DC origin offset, IQ Gain and Phase imbalance are reported in the Summary display. Pass/Fail results are reported using customizable limits. |
| AM/FM/PM modulation and audio measurements
(Opt. SVA) | Carrier Power, Frequency Error, Modulation Frequency, Modulation Parameters (±peak, peak-peak/2, RMS), SINAD, Modulation Distortion, S/N, THD, TNHD, Hum and Noise |
| Settling time (frequency and phase)
(Opt. SVT) | Measured Frequency, Settling Time from last settled frequency, Settling Time from last settled phase, Settling Time from Trigger. Automatic or manual reference frequency selection. User-adjustable measurement bandwidth, averaging, and smoothing. Pass/Fail Mask Testing with 3 user-settable zones |
| Advanced Pulse analysis (Opt.
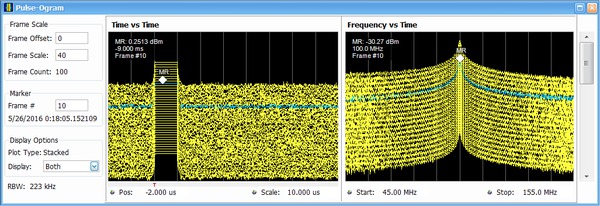
SVP) | Pulse-Ogram™ waterfall display of multiple segmented captures, with amplitude vs time and spectrum of each pulse. Pulse frequency, Delta Frequency, Average on power, Peak power, Average transmitted power, Pulse width, Rise time, Fall time, Repetition interval (seconds), Repetition interval (Hz), Duty factor (%), Duty factor (ratio), Ripple (dB), Ripple (%), Droop (dB), Droop (%), Overshoot (dB), Overshoot (%), Pulse- Ref Pulse frequency difference, Pulse- Ref Pulse phase difference, Pulse- Pulse frequency difference, Pulse- Pulse phase difference, RMS frequency error, Max frequency error, RMS phase error, Max phase error, Frequency deviation, Phase deviation, Impulse response (dB), Impulse response (time), Time stamp. |
| Flexible OFDM analysis
(Opt. SVO) | OFDM analysis with support for WLAN 802.11a/g/j and WiMAX 802.16-2004. Constellation, Scalar Measurement Summary, EVM or Power vs. Carrier, Symbol Table (Binary or Hexadecimal) |
| General purpose digital modulation analysis
(Opt. SVM) | Error Vector Magnitude (EVM) (RMS, Peak, EVM vs. Time), Modulation Error Ratio (MER), Magnitude Error (RMS, Peak, Mag Error vs. Time), Phase Error (RMS, Peak, Phase Error vs. Time), Origin Offset, Frequency Error, Gain Imbalance, Quadrature Error, Rho, Constellation, Symbol Table.
FSK only: Frequency Deviation, Symbol Timing Error |
Specifications
Performance (typical)
The following is typical performance of SignalVu® running on any DPO70000 SX oscilloscope models, or DPO/MSO70000 DX Series oscilloscopes.
- Frequency-related
- Frequency range
- See appropriate instrument data sheet
- Initial center frequency setting accuracy
- Equal to time-base accuracy of instrument
- Center frequency setting resolution
- 0.1 Hz
- Frequency offset range
- 0 Hz to the maximum bandwidth of the oscilloscope
- Frequency marker readout accuracy
- ±(Reference Frequency Error × Marker Frequency + 0.001 × Span + 2) Hz
- Span accuracy
- ±0.3%
- Reference frequency error
- Equal to oscilloscope reference frequency accuracy, aging, and drift. Refer to appropriate DPO/MSO data sheet.
- Tuning Tables
- Tables that present frequency selection in the form of standards-based channels are available for the following.
- Cellular standards families: AMPS, NADC, NMT-450, PDC, GSM, CDMA, CDMA-2000, 1xEV-DO WCDMA, TD-SCDMA, LTE, WiMax
- Unlicensed short range: 802.11a/b/j/g/p/n/ac, Bluetooth
- Cordless phone: DECT, PHS
- Broadcast: AM, FM, ATSC, DVBT/H, NTSC
- Mobile radio, pagers, other: GMRS/FRS, iDEN, FLEX, P25, PWT, SMR, WiMax
- 3rd order inter-modulation distortion45
Center frequency DPO/MSO70000 DPO70000SX 2 GHz -55 dBc < -60 dBc 10 GHz -48 dBc < -50 dBc 18 GHz -50 dBc < -50 dBc
- Residual responses5
- DPO/MSO70000DX/SX series (all spans)
- –60 dBm
- Displayed average noise level58
Span DPO/MSO70000 DPO70000SX DC - 500 MHz -103 dBm < -145 dBm/Hz >500 MHz - 3.5 GHz -103 dBm < -155 dBm/Hz >3.5 GHz - 14 GHz -101 dBm < -155 dBm/Hz >14 GHz - 20 GHz -88 dBm < -155 dBm/Hz >20 GHz - 25 GHz -87 dBm < -150 dBm/Hz >25 GHz - 33 GHz -85 dBm < -150 dBm/Hz >33 GHz - 70 GHz - < -150 dBm/Hz
- Input-related
- Number of inputs9
- 4
- Input signal types
- RF, I and Q (single ended), I and Q (differential)
- Maximum input level
- +26 dBm for 50 Ω input (5 VRMS)
- Trigger-related
- Trigger modes
- Free Run and Triggered. Trigger sensitivity and characteristics can be found in the appropriate oscilloscope data sheet.
- Acquisition-related
- SignalVu provides long acquisitions of waveform captures with high time and frequency resolution. Maximum acquisition time will vary based on the oscilloscope's available memory and analog bandwidth. The following table highlights each model's single-channel capabilities given its maximum available memory configuration.
- 70000SX models
Oscilloscope dependent SignalVu dependency Oscilloscope dependent Model Max span Max acquisition time at max sample rate 10 Min RBW at max sample rate Min IQ time resolution Max number of FastFrames DPO77002SX 70 GHz 5 ms 600 Hz 20 ps SX 10 ps DX
369 K DPO75002SX 50 GHz DPO73304SX 33 GHz 10 ms 300 Hz 10 ps DPO72504SX 25 GHz 20 ps DPO72304SX 23 GHz DPO71604SX 16 GHz DPO71304SX 13 GHz
- Analysis-related
- Frequency (Opt. SVE)
- Spectrum (Amplitude vs. Linear or Log Frequency)
- Spectrogram (Amplitude vs. Frequency over Time)
- Spurious (Amplitude vs. Linear or Log Frequency)
- Time and statistics (Opt. SVE)
- Amplitude vs. Time
- Frequency vs. Time
- Phase vs. Time
- Amplitude Modulation vs. Time
- Frequency Modulation vs. Time
- Phase Modulation vs. Time
- RF IQ vs. Time
- Time Overview
- CCDF
- Peak-to-Average Ratio
- Settling time, frequency, and phase (Opt. SVT)
- Frequency Settling vs. Time
- Phase Settling vs. Time
- Advanced Pulse measurements suite (Opt. SVP)
- Pulse results Table
- Pulse trace (Selectable by pulse number)
- Pulse statistics (Trend of pulse results, FFT of time trend and histogram)
- Cumulative Statistics, Cumulative Histogram and Pulse-Ogram
- Digital demod (Opt. SVM)
- Constellation diagram
- EVM vs. Time
- Symbol table (binary or hexadecimal)
- Magnitude and Phase Error vs. Time, and Signal Quality
- Demodulated IQ vs. Time
- Eye diagram
- Trellis diagram
- Frequency Deviation vs. Time
- Flexible OFDM (Opt. SVO)
- EVM vs. Symbol, vs. Subcarrier
- Subcarrier Power vs. Symbol, vs. Subcarrier
- Subcarrier constellation
- Symbol data table
- Mag Error vs. Symbol, vs. Subcarrier
- Phase Error vs. Symbol, vs. Subcarrier
- Channel frequency response
- Supported file formats
- SignalVu can recall saved acquisitions from DPO/MSO70000 Series instruments. Both WFM and TIQ file extensions can be recalled for postprocessing by SignalVu.
RF and spectrum analysis performance
- Resolution bandwidth
- Resolution bandwidth (spectrum analysis)
- 1, 2, 3, 5 sequence, auto-coupled, or user selected (arbitrary)
- Resolution bandwidth shape
- Approximately Gaussian, shape factor 4.1:1 (60:3 dB) ±10%, typical
- Resolution bandwidth accuracy
- ±1% (auto-coupled RBW mode)
- Alternative resolution bandwidth types
- Kaiser window (RBW), –6 dB Mil, CISPR, Blackman-Harris 4B window, Uniform window (none), flat-top window (CW ampl.), Hanning window
- Video bandwidth
- Video bandwidth range
- Dependent on oscilloscope record length setting. approximately 500 Hz to 5 MHz
- RBW/VBW maximum
- 10,000:1
- RBW/VBW minimum
- 1:1
- Resolution
- 5% of entered value
- Accuracy (typical)
- ±10%
- Time domain bandwidth (amplitude vs. time display)
- Time domain bandwidth range
- At least 1/2 to 1/10,000 of acquisition bandwidth
- Time domain bandwidth shape
Approximately Gaussian, shape factor 4.1:1(60:3 dB), ±10% typical
Shape factor <2.5:1 (60:3 dB) typical for all bandwidths
- Time domain bandwidth accuracy
- ±10%
- Spectrum and Spurious display traces, detectors, and functions
- Traces
- Three traces + 1 math trace + 1 trace from spectrogram for spectrum display, four traces for spurious display
- Detector
- Peak, –peak, average, CISPR peak, and when option SVQP is enabled, CISPR quasi-peak and average (not available when connected to MDO4000B/C or MSO5/6 Series)
- Trace functions
- Normal, Average, Max Hold, Min Hold
- Spectrum trace length
- 801, 2401, 4001, 8001, 10401, 16001, 32001, or 64001 points
AM/FM/PM modulation and audio measurements (SVA)
All published performance based on conditions of Input Signal: 0 dBm, Input Frequency: 100 MHz, RBW: Auto, Averaging: Off, Filters: Off. Sampling and input parameters optimized for best results.
- Carrier frequency range11
- 1 kHz or (1/2 × audio analysis bandwidth) to maximum input frequency
- Maximum audio frequency span
- 10 MHz
- Audio filters
- Low pass (kHz)
- 0.3, 3, 15, 30, 80, 300, and user-entered up to 0.9 × audio bandwidth
- High pass (Hz)
- 20, 50, 300, 400, and user-entered up to 0.9 × audio bandwidth
- Standard
- CCITT, C-Message
- De-emphasis (µs)
- 25, 50, 75, 750, and user-entered
- File
- User-supplied .TXT or .CSV file of amplitude/frequency pairs. Maximum 1000 pairs.
- FM modulation analysis
- FM measurements,
- Carrier power, carrier frequency error, audio frequency, deviation (+peak, –peak, peak-peak/2, RMS), SINAD, modulation distortion, S/N, total harmonic distortion, total non-harmonic distortion, hum and noise
- FM deviation accuracy
- ±1.5% of deviation
- FM rate accuracy
- ±1.0 Hz
- Carrier frequency accuracy
- ±1 Hz + (transmitter frequency × reference frequency error)
- Residuals (FM) (rate: 1 kHz to 10 kHz, deviation: 5 kHz)
- THD
0.2% (DPO70000 Series)
- SINAD
44 dB (DPO70000 Series)
- AM modulation analysis
- AM measurements
- Carrier power, audio frequency, modulation depth (+peak, –peak, peak-peak/2), RMS, SINAD, modulation distortion, S/N, total harmonic distortion, total non-harmonic distortion, hum and noise
- AM depth accuracy (rate: 1 kHz, depth: 50%)
- ±1% + 0.01 × measured value
- AM rate accuracy (rate: 1 kHz, depth: 50%)
- ±1.0 Hz
- Residuals (AM)
- THD
0.3% (DPO70000 Series)
- SINAD
48 dB (DPO70000 Series)
- PM modulation analysis
- PM measurement
- Carrier power, carrier frequency error, audio frequency, deviation (+peak, –peak, peak-peak/2, RMS), SINAD, modulation distortion, S/N, total harmonic distortion, total non-harmonic distortion, hum and noise
- PM deviation accuracy (rate: 1 kHz, deviation: 0.628 rad)
- ±100% × (0.01 + (rate / 1 MHz))
- PM rate accuracy (rate: 1 kHz, deviation: 0.628 rad)
- ±1 Hz
- Residuals (PM)
- THD
0.1% (DPO70000 Series)
- SINAD
48 dB (DPO70000 Series)
- Direct audio input
- Audio measurements
- Signal power, audio frequency (+peak, –peak, peak-peak/2, RMS), SINAD, modulation distortion, S/N, total harmonic distortion, total non-harmonic distortion, hum and noise
- Direct input frequency range (for audio measurements only)
1 Hz to 10 MHz
- Maximum audio frequency span
10 MHz
- Audio frequency accuracy
- ±1 Hz
- Residuals (PM)
- THD
- 1.5%
- SINAD
- 38 dB
- Minimum audio analysis bandwidth and RBW vs. oscilloscope memory and sample rate
- (Opt. SVA)
Model Sample rate: 1 GS/s Sample rate: maximum Standard memory Maximum memory Standard memory Maximum memory Min. Aud. BW RBW (Auto) Min. Aud. BW RBW (Auto) Min. Aud. BW RBW (Auto) Min. Aud. BW RBW (Auto) DPO/ MSO
70000 ≥12.5 GHz BW
200 kHz
400 Hz
10 kHz
20 Hz
not recom-mended
>4 kHz
1 MHz
2 kHz
DPO/ MSO 70000 <12.5 GHz BW
200 kHz
400 Hz
20 kHz
40 Hz
not recom-mended
>4 kHz
500 kHz
1 kHz
Settling time, frequency, and phase (SVT)
- Settled frequency uncertainty12
- Measurement frequency: 1 GHz
Averages Frequency uncertainty at stated measurement bandwidth 1 GHz 100 MHz 10 MHz 1 MHz Single measurement 20 kHz 2 kHz 500 Hz 100 Hz 100 averages 10 kHz 500 Hz 200 Hz 50 Hz 1000 averages 2 kHz 200 Hz 50 Hz 10 Hz - Measurement frequency: 9 GHz
Averages Frequency uncertainty at stated measurement bandwidth 1 GHz 100 MHz 10 MHz 1 MHz Single Measurement 20 kHz 5 kHz 2 kHz 200 Hz 100 Averages 10 kHz 2 kHz 500 Hz 50 Hz 1000 Averages 2 kHz 500 Hz 200 Hz 20 Hz
- Settled phase uncertainty12
- Measurement frequency: 1 GHz
Averages Phase uncertainty at stated measurement bandwidth 1 GHz 100 MHz 10 MHz 1 MHz Single measurement 2° 2° 2° 2° 100 averages 0.5° 0.5° 0.5° 0.5° 1000 averages 0.2° 0.2° 0.2° 0.2° - Measurement frequency: 9 GHz
Averages Phase uncertainty at stated measurement bandwidth 1 GHz 100 MHz 10 MHz 1 MHz Single measurement 5° 5° 5° 5° 100 averages 2° 2° 2° 2° 1000 averages 0.5° 0.5° 0.5° 0.5°
Advanced Pulse measurement suite (Opt. SVP)
- General characteristics
- Measurements
- Pulse-Ogram™ waterfall display of multiple segmented captures, with amplitude vs time and spectrum of each pulse. Pulse frequency, Delta Frequency, Average on power, Peak power, Average transmitted power, Pulse width, Rise time, Fall time, Repetition interval (seconds), Repetition interval (Hz), Duty factor (%), Duty factor (ratio), Ripple (dB), Ripple (%), Droop (dB), Droop (%), Overshoot (dB), Overshoot (%), Pulse- Ref Pulse frequency difference, Pulse- Ref Pulse phase difference, Pulse- Pulse frequency difference, Pulse- Pulse phase difference, RMS frequency error, Max frequency error, RMS phase error, Max phase error, Frequency deviation, Phase deviation, Impulse response (dB), Impulse response (time), Time stamp.
- Number of pulses
- 1 to 100,000 13 in one acquisition; Supports offline analysis of more than 200,000 continuous pulses. Provides measurement statistics for millions of pulses captured over many acquisitions.
- System rise time (typical)
- Equal to oscilloscope rise time
- Minimum pulse width for detection14
Model Minimum PW DPO77002SX 40 ps DPO75002SX 40 ps DPO73304SX 40 ps DPO72504SX 40 ps DPO72304SX 40 ps DPO71604SX 40 ps DPO71304SX 40 ps
- Pulse measurement accuracy (typical)12
- Average on power
- ±0.3 dB + Absolute Amplitude Accuracy of instrument
- Average transmitted power
- ±0.4 dB + Absolute Amplitude Accuracy of instrument
- Peak power
- ±0.4 dB + Absolute Amplitude Accuracy of instrument
- Pulse width
- ±(3% of reading + 0.5 × sample period)
- Pulse repetition rate
- ±(3% of reading + 0.5 × sample period)
Digital modulation analysis (SVM)
- Modulation formats
- π/2DBPSK, BPSK, SBPSK, QPSK, DQPSK, π/4DQPSK, D8PSK, 8PSK, OQPSK, SOQPSK, CPM, 16/32/64/128/256/1024QAM, MSK, 2-FSK, 4-FSK, 8-FSK, 16-FSK, C4FM, D16PSK, 16APSK, and 32APSK
- Analysis period
- Up to 80,000 samples
- Measurement filters
- Square-root raised cosine, raised cosine, Gaussian, rectangular, IS-95, IS-95 EQ, C4FM-P25, half-sine, None, User Defined
- Reference filters
- Raised cosine, Gaussian, rectangular, IS-95, SBPSK-MIL, SOQPSK-MIL, SOQPSK-ARTM, None, User Defined
- Alpha/B x T range
- 0.001 to 1, 0.001 step
- Measurements
Constellation, Error Vector Magnitude (EVM) vs time, Modulation error ratio (MER), Magnitude error vs time, Phase error vs time, Signal quality, Symbol table
rhoFSK only: Frequency deviation, Symbol timing error
- Symbol rate range
- 1 kS/s to (0.4 * Sample Rate) GS/s (modulated signal must be contained entirely within the acquisition bandwidth)
- Adaptive equalizer
- Type
- Linear, decision-directed, feed-forward (FIR) equalizer with coefficient adaptation and adjustable convergence rate
- Modulation types supported
- BPSK, QPSK, OQPSK π/2 DQPSK, π/4 DQPSK, 8PSK, D8PSK, D16PSK, 16/32/64/128/256/1024QAM
- Reference filters for all modulation types except OQPSK
- Raised cosine, Rectangular, None
- Reference filters for OQPSK
- Raised cosine, Half sine
- Filter length
- 1-128 taps
- Taps/symbol: raised cosine, half sine, no filter
- 1, 2, 4, 8
- Taps/symbol: rectangular filter
- 1
- Equalizer controls
- Off, Train, Hold, Reset
- 16QAM Residual EVM (typical) for DPO/MSO70000 series12
Symbol Rate RF IQ 100 MS/s < 2.0% < 2.0% 312.5 MS/s < 3.0% < 3.0%
- OFDM residual EVM, 802.11g Signal at 2.4 GHz, input level optimized for best performance
- DPO/MSO70000 Series
- –38 dB
WLAN IEEE802.11a/b/g/j/p (Opt. SV23)
- General characteristics
- Modulation formats
- DBPSK (DSSS1M), DQPSK (DSSS2M), CCK5.5M, CCK11M, OFDM (BPSK, QPSK, 16 or 64QAM)
- Measurements
RMS and Peak EVM for Pilots/Data, Peak EVM located per symbol and subcarrier
Packet header format information
Average power and RMS EVM per section of the header
WLAN power vs time, WLAN symbol table, WLAN constellation
Spectrum Emission Mask, Spurious
Error Vector Magnitude (EVM) vs symbol (or time), vs subcarrier (or frequency)
Mag error vs symbol (or time), vs subcarrier (or frequency)
Phase error vs symbol (or time), vs subcarrier (or frequency)
WLAN channel frequency response vs symbol (or time), vs subcarrier (or frequency)
WLAN spectral flatness vs symbol (or time), vs subcarrier (or frequency)
WLAN IEEE802.11n (Opt. SV24)
- General characteristics
- Modulation formats
- OFDM (BPSK, QPSK, 16 or 64 QAM), SISO
- Measurements
Burst index, Burst power, Peak to average burst power, IQ origin offset, Frequency error, Common pilot error, Symbol clock error
RMS and peak EVM for Pilots/Data, peak EVM located per symbol and subcarrier
Packet header format information
Average power and RMS EVM per section of the header
WLAN power vs time, WLAN symbol table, WLAN constellation
Spectrum emission mask, spurious
Error Vector Magnitude (EVM) vs symbol (or time), vs subcarrier (or frequency)
Mag error vs symbol (or time), vs subcarrier (or frequency)
Phase error vs symbol (or time), vs subcarrier (or frequency)
WLAN channel frequency response vs symbol (or time), vs subcarrier (or frequency)
WLAN spectral flatness vs symbol (or time), vs subcarrier (or frequency)
WLAN IEEE802.11ac (Opt. SV25)
- General characteristics
- Modulation formats
- OFDM (BPSK, QPSK, 16 QAM, 64 QAM, 256 QAM), SISO
- Measurements
Burst index, Burst power, Peak to average burst power, IQ origin offset,Frequency error, Common pilot error, Symbol clock error
RMS and peak EVM for Pilots/Data, Peak EVM located per symbol and subcarrier
Packet header format information
Average power and RMS EVM per section of the header
WLAN Power vs time, WLAN symbol table, WLAN constellation
Spectrum emission mask, spurious
Error Vector Magnitude (EVM) vs symbol (or time), vs subcarrier (or frequency)
Mag error vs symbol (or time), vs subcarrier (or frequency)
Phase error vs symbol (or time), vs subcarrier (or frequency)
WLAN channel frequency response vs symbol (or time), vs subcarrier (or frequency)
WLAN spectral flatness vs symbol (or time), vs subcarrier (or frequency)
WiGig 802.11ad/ay (Opt. SV30)
- Modulation formats
802.11ad MCS0-12.6,
802.11ay MCS1-21
802.11ad Control PHY (pi/2 DBPSK)
802.11ad and 802.11ay Single Carrier PHY (pi/2 BPSK, pi/2 QPSK, pi/2 16QAM, pi/2 64QAM)
- Measurements and displays
- RF output power, Received Channel Power Indicator (RCPI), Estimated SNR, Frequency Error,
Symbol Rate Error, IQ Origin Offset, IQ Gain Imbalance, IQ Phase Imbalance, IQ Quadrature Error,
EVM results for each packet region: Packet information, 802.11ad (STF, CEF, Header, Guard, and Data), 802.11ay (LSTF, LCEF, L Header, EDMG Header-A, EDMG STF, EDMG CEF Guard and Data
include the Packet type, Preamble, Synchronization Word or Access Code, Packet
Header, Payload length, and CRC details.
- Residual EVM, measured at RF (Channel 1-6) on DPO770002SX
- Residual EVM
- Measurement uncertainty: ± 0.3% due to pre-compensation filter and affects of the AWG70000 and upconverter.
802.11ad MCS0-12.6 802.11ay MCS1-21 Channel1-4 1.2 - 1.6%
(-38.4 to -35.9 dBc)
1.2 - 1.6%
(-38.4 to -35.9 dBc)
Channel 5-6 1.4 - 2.5%
(-37.1 to -32.0 dBc)
1.4 - 2.5%
(-37.1 to -32.0 dBc)
Channel 1-2, 2-3, 3-4 (adjacent bonded)
NA 1.2 - 1.7%
(-38.4 to -35.4 dBc)
Channel 4-5, 5-6 (adjacent bonded)
NA < 2.5%
(< -32.0 dBc)
APCO P25 (Opt. SV26)
- Modulation formats
- Phase 1 (C4FM), Phase 2 (HCPM, HDQPSK)
- Measurements and displays
- RF output power, operating frequency accuracy, modulation emission spectrum,
unwanted emissions spurious, adjacent channel power ratio, frequency deviation,
modulation fidelity, frequency error, eye diagram, symbol table, symbol rate accuracy,
transmitter power and encoder attack time, transmitter throughput delay, frequency
deviation vs. time, power vs. time, transient frequency behavior, HCPM transmitter logical
channel peak adjacent channel power ratio, HCPM transmitter logical channel off slot power,
HCPM transmitter logical channel power envelope, HCPM transmitter logical channel time alignment
Bluetooth (Opt. SV27)
- Modulation formats
- Bluetooth® 4.2 Basic Rate, Bluetooth® 4.2 Low Energy, Bluetooth® 4.2 Enhanced Data Rate. Bluetooth® 5 when SV31 is enabled.
- Measurements and displays
Peak Power, Average Power, Adjacent Channel Power or InBand Emission mask, -20 dB Bandwidth, Frequency Error, Modulation Characteristics including ΔF1avg (11110000), ΔF2avg (10101010), ΔF2 > 115 kHz, ΔF2/ΔF1 ratio, frequency deviation vs. time with packet and octet level measurement information, Carrier Frequency f0, Frequency Offset (Preamble and Payload), Max Frequency Offset, Frequency Drift f1-f0, Max Drift Rate fn-f0 and fn-fn-5, Center Frequency Offset Table and Frequency Drift table, color-coded Symbol table, Packet header decoding information, eye diagram, constellation diagram.
LTE Downlink (Opt. SV28)
- Standard Supported
- 3GPP TS 36.141 Version 12.5
- Frame Format supported
- FDD and TDD
- Measurements and Displays Supported
- Adjacent Channel Leakage Ratio (ACLR), Spectrum Emission Mask (SEM), Channel Power, Occupied Bandwidth, Power vs. Time showing Transmitter OFF power for TDD signals and LTE constellation diagram for PSS, SSS with Cell ID, Group ID, Sector ID and Frequency Error.
5G NR Uplink/Downlink measurements (Opt. 5GNR)
- Standard supported
- TS 38.141-1 for BS and 38.521-1 for UE
- Modulation accuracy
- Sec 6.5.2 for BS and Sec 6.4.2 for UE.
- ACP
- Sec 6.6.3 for BS and Sec 6.5.2.4 for UE
- Frame format supported
- Uplink (FDD and TDD)
- Downlink (FDD and TDD)
- Measurements and displays supported
- Channel Power (CHP), Adjacent Channel Power (ACP), Power Vs Time (PVT)3, Modulation Accuracy (including Error Vector Magnitude (EVM), Frequency Error, IQ Error), EVM vs. Symbol, Occupied Bandwidth (OBW), Spectral Emission Mask (SEM), Constellation Diagram, and summary table with scalar results.
- EVM (typical)
1 GHz 2 GHz 3 GHz 4 GHz 5 GHz 6 GHz 7 GHz 0.50% 0.50% 0.70% 0.70% 0.70% 0.90% 0.90% - ACLR (typical)
- -48 dBc at all frequencies up to 7 GHz
General characteristics
- GPIB
- SCPI-compatible, see programmer manual for exceptions
Ordering information
Options
- Opt. SVE
- SignalVu Essentials - Vector Signal Analysis Software
- Opt. SV23
- WLAN 802.11a/b/g/j/p measurement application (requires Opt. SVE, requires oscilloscope of bandwidth of 2.5 GHz or above)
- Opt. SV24
- WLAN 802.11n measurement application (requires Opt. SV23, requires oscilloscope of bandwidth of 2.5 GHz or above)
- Opt. SV25
- WLAN 802.11ac measurement application (requires Opt. SV24, requires oscilloscope of bandwidth of 6.0 GHz or above)
- Opt. SV26
- APCO P25 measurement application
- Opt. SV27
- Bluetooth Basic LE Tx Measurements (requires Opt. SVE, requires oscilloscope of bandwidth of 2.5 GHz or above)
- Opt. SV28
- LTE Downlink RF measurements (requires Opt. SVE, requires oscilloscope of bandwidth 1 GHz or above).
- Opt. 5GNR
- 5G NR Uplink/Downlink RF analysis software (Available as upgrade only. Requires Opt. SVE)
- Opt. SV30
- IEEE802.11ad/ay SC Wideband Waveform Analysis (requires Opt. SVE, requires oscilloscope of bandwidth >3 GHz
- Opt. SVP
- Advanced pulse radar analysis (requires Opt. SVE)
- Opt. SVM
- General Purpose Digital Modulation Analysis (requires Opt. SVE)
- Opt. SVT
- Settling Time, Frequency, and Phase (requires Opt. SVE)
- Opt. SVO
- Flexible OFDM with support for 802.11a/j/g and 802.16-2044 (fixed WiMAX) modulation types.
- Opt. SVA
- AM/FM/PM Modulation and Audio Measurements (requires Opt. SVE)
Option ordering nomenclature for all oscilloscopes. Option SVE is required for all other options listed.
For information on analysis software that runs on your personal computer, please see the SignalVu-PC datasheet.
- New and existing models
Model Ordering on new instrument Upgrade existing instrument DPO/MSO70000 Series ≤8 GHz Opt. SVE (Essentials) DPO-UP Opt. SVEH DPO/MSO70000 Series >8 GHz Opt. SVE (Essentials) DPO-UP Opt. SVEU Option SVE required for all other options listed Opt. SVT (Settling time) DPO-UP Opt. SVT Opt. SVP (Pulse measurements) DPO-UP Opt. SVP Opt. SVM (GP modulation analysis) DPO-UP Opt. SVM Opt. SVO (OFDM) DPO-UP Opt. SVO Opt. SVA (AM/FM/PM Audio) DPO-UP Opt. SVA Opt. SV26 (APCO P25) DPO-UP Opt. SV26 DPO/MSO70000 Series ≥2.5 GHz Opt. SV23 (IEEE802.11a/b/g/j/p) DPO-UP Opt. SV23 Option SV23 required for SV24 Opt. SV24 (IEEE802.11n) DPO-UP Opt .SV24 Option SV24 required for SV25 Opt. SV25 (IEEE802.11ac) DPO-UP Opt. SV25 DPO/MSO70000 Series ≥2.5 GHz Opt. SV27 (Bluetooth) DPO-UP Opt. SV27 DPO/MSO70000 Series ≥1 GHz Opt. SV28 (LTE Downlink) DPO-UP Opt. SV28 DPO70000 SX Series only Opt. SV30 (IEEE 802.11ad/ay) DPO-UP Opt. SV30 DPO70000 SX Series only DPO-UP Opt. 5GNR17
- Legacy models
- DPO7000 Series, DPO/DSA/MSO70000 Series
Earlier DPO/DSA/MSO70000 Series oscilloscopes may be retrofitted with SignalVu. These instruments use a Microsoft Windows XP operating system, have oscilloscope firmware version 5.1 or above, and are compatible with SignalVu version 2.3.0072. See upgrade nomenclature table above for ordering information. Option SVO (OFDM), Option SVA (AM/FM/PM Audio), and Options SV23, SV23, SV25, SV26, SV27, SV28, SV30 (WLAN, Bluetooth, WiGig, LTE and P25) are not available on instruments with Microsoft Windows XP.
5GNR Analysis is not supported on Windows 8/8.1, Window 7, and Windows XP.


